
Views of the Solar System presents a vivid multimedia adventure unfolding the splendor of the Sun, planets, moons, comets, asteroids, and more. Discover the latest scientific information, or study the history of space exploration, rocketry, early astronauts, space missions, spacecraft through a vast archive of photographs, scientific facts, text, graphics and videos. Views of the Solar System offers enhanced exploration and educational enjoyment of the solar system and beyond.
Our solar system consists of an average star we call the Sun, the planets Mercury, Venus, Earth, Mars, Jupiter, Saturn, Uranus, Neptune, and Pluto. It includes: the satellites of the planets; numerous comets, asteroids, and meteoroids; and the interplanetary medium. The Sun is the richest source of electromagnetic energy (mostly in the form of heat and light) in the solar system. The Sun's nearest known stellar neighbor is a red dwarf star called Proxima Centauri, at a distance of 4.3 light years away. The whole solar system, together with the local stars visible on a clear night, orbits the center of our home galaxy, a spiral disk of 200 billion stars we call the Milky Way. The Milky Way has two small galaxies orbiting it nearby, which are visible from the southern hemisphere. They are called the Large Magellanic Cloud and the Small Magellanic Cloud. The nearest large galaxy is the Andromeda Galaxy. It is a spiral galaxy like the Milky Way but is 4 times as massive and is 2 million light years away. Our galaxy, one of billions of galaxies known, is traveling through intergalactic space.
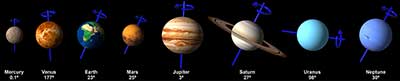
The planets, most of the satellites of the planets and the asteroids revolve around the Sun in the same direction, in nearly circular orbits. When looking down from above the Sun's north pole, the planets orbit in a counter-clockwise direction. The planets orbit the Sun in or near the same plane, called the ecliptic. Pluto is a special case in that its orbit is the most highly inclined (18 degrees) and the most highly elliptical of all the planets. Because of this, for part of its orbit, Pluto is closer to the Sun than is Neptune. The axis of rotation for most of the planets is nearly perpendicular to the ecliptic. The exceptions are Uranus and Pluto, which are tipped on their sides.
The solar wind can be measured by spacecraft, and it has a large effect on comet tails. It also has a measurable effect on the motion of spacecraft. The speed of the solar wind is about 400 kilometers (250 miles) per second in the vicinity of Earth's orbit. The point at which the solar wind meets the interstellar medium, which is the "solar" wind from other stars, is called the heliopause. It is a boundary theorized to be roughly circular or teardrop-shaped, marking the edge of the Sun's influence perhaps 100 AU from the Sun. The space within the boundary of the heliopause, containing the Sun and solar system, is referred to as the heliosphere.
The solar magnetic field extends outward into interplanetary space; it can be measured on Earth and by spacecraft. The solar magnetic field is the dominating magnetic field throughout the interplanetary regions of the solar system, except in the immediate environment of planets which have their own magnetic fields.
The terrestrial planets are the four innermost planets in the solar system, Mercury, Venus, Earth and Mars. They are called terrestrial because they have a compact, rocky surface like the Earth's. The planets, Venus, Earth, and Mars have significant atmospheres while Mercury has almost none. The following diagram shows the approximate distance of the terrestrial planets to the Sun.

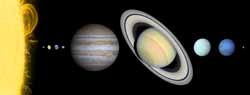
Jupiter, Saturn, Uranus, and Neptune are known as the Jovian (Jupiter-like) planets, because they are all gigantic compared with Earth, and they have a gaseous nature like Jupiter's. The Jovian planets are also referred to as the gas giants, although some or all of them might have small solid cores. The following diagram shows the approximate distance of the Jovian planets to the Sun.
 Our Milkyway Galaxy
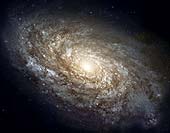
This image of our galaxy, the Milky Way, was taken with NASA's Cosmic Background Explorer's (COBE) Diffuse Infrared Background Experiment (DIRBE). This never-before-seen view shows the Milky Way from an edge-on perspective with the galactic north pole at the top, the south pole at the bottom and the galactic center at the center. The picture combines images obtained at several near-infrared wavelengths. Stars within our galaxy are the dominant source of light at these wavelengths. Even though our solar system is part of the Milky Way, the view looks distant because most of the light comes from the population of stars that are closer to the galactic center than our own Sun. (Courtesy NASA)
 Our Milky Way Gets a Makeover
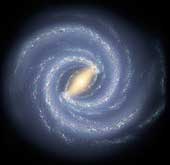
Like early explorers mapping the continents of our globe, astronomers are busy charting the spiral structure of our galaxy, the Milky Way. Using infrared images from NASA's Spitzer Space Telescope, scientists have discovered that the Milky Way's elegant spiral structure is dominated by just two arms wrapping off the ends of a central bar of stars. Previously, our galaxy was thought to possess four major arms.
This artist's concept illustrates the new view of the Milky Way, along with other findings presented at the 212th American Astronomical Society meeting in St. Louis, Mo. The galaxy's two major arms (Scutum-Centaurus and Perseus) can be seen attached to the ends of a thick central bar, while the two now-demoted minor arms (Norma and Sagittarius) are less distinct and located between the major arms. The major arms consist of the highest densities of both young and old stars; the minor arms are primarily filled with gas and pockets of star-forming activity.
The artist's concept also includes a new spiral arm, called the "Far-3 kiloparsec arm," discovered via a radio-telescope survey of gas in the Milky Way. This arm is shorter than the two major arms and lies along the bar of the galaxy.
Our sun lies near a small, partial arm called the Orion Arm, or Orion Spur, located between the Sagittarius and Perseus arms. (Courtesy NASA/JPL-Caltech)
 Spiral Galaxy, NGC 4414
The majestic galaxy, NGC 4414, is located 60 million light-years away. Like the Milky Way, NGC 4414 is a giant spiral-shaped disk of stars, with a bulbous central hub of older yellow and red stars. The outer spiral arms are considerably bluer due to ongoing formation of young, blue stars, the brightest of which can be seen individually at the high resolution provided by the Hubble camera. The arms are also very rich in clouds of interstellar dust, seen as dark patches and streaks silhouetted against the starlight. (Courtesy NASA/STSCI)
 Obliquity of the Eight Planets
This illustration shows the obliquity of the eight planets. Obliquity is the angle between a planet's equatorial plane and its orbital plane. By International Astronomical Union (IAU) convention, a planet's north pole lies above the ecliptic plane. By this convention, Venus, Uranus, and Pluto have a retrograde rotation, or a rotation that is in the opposite direction from the other planets. (Copyright 2008 by Calvin J. Hamilton)
 The Solar System
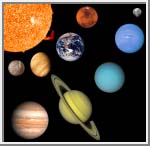
During the past three decades a myriad of space explorers have escaped the confines of planet Earth and have set out to discover our planetary neighbors. This picture shows the Sun and all nine planets of the solar system as seen by the space explorers. Starting at the top-left corner is the Sun followed by the planets Mercury, Venus, Earth, Mars, Jupiter, Saturn, Uranus, Neptune, and Pluto. (Copyright 1998 by Calvin J. Hamilton)
 Sun and Planets
This image shows the Sun and nine planets approximately to scale. The order of these bodies are: Sun, Mercury, Venus, Earth, Mars, Jupiter, Saturn, Uranus, Neptune, and Pluto. (Copyright Calvin J. Hamilton)
 Jovian Planets
This image shows the Jovian planets Jupiter, Saturn, Uranus and Neptune approximately to scale. The Jovian planets are named because of their gigantic Jupiter-like appearance. (Copyright Calvin J. Hamilton)
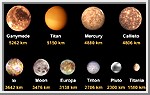 The Largest Moons and Smallest Planets
This image shows the relative sizes of the largest moons and the smallest planets in the solarsystem. The largest satellites pictured in this image are: Ganymede (5262 km), Titan (5150 km), Callisto (4806 km), Io (3642 km), the Moon (3476 km), Europa (3138 km), Triton (2706 km), and Titania (1580 km). Both Ganymede and Titan are larger than planet Mercury followed by Io, the Moon, Europa, and Triton which are larger than the planet Pluto. (Copyright Calvin J. Hamilton)
 Diagram of Portrait Frames
On February 14, 1990, the cameras of Voyager 1 pointed back toward the Sun and took a series of pictures of the Sun and the planets, making the first ever "portrait" of our solar system as seen from the outside. This image is a diagram of how the frames for the solar system portrait were taken. (Courtesy NASA/JPL)
 All Frames from the Family Portrait
This image shows the series of pictures of the Sun and the planets taken on February 14, 1990, for the solar system family portrait as seen from the outside. In the course of taking this mosaic consisting of a total of 60 frames, Voyager 1 made several images of the inner solar system from a distance of approximately 6.4 billion kilometers (4 billion miles) and about 32° above the ecliptic plane. Thirty-nine wide angle frames link together six of the planets of our solar system in this mosaic. Outermost Neptune is 30 times further from the Sun than Earth. Our Sun is seen as the bright object in the center of the circle of frames. The insets show the planets magnified many times. (Courtesy NASA/JPL)
 Portrait of the Solar System
These six narrow-angle color images were made from the first ever "portrait" of the solar system taken by Voyager 1, which was more than 6.4 billion kilometers (4 billion miles) from Earth and about 32° above the ecliptic. Mercury is too close to the Sun to be seen. Mars was not detectable by the Voyager cameras due to scattered sunlight in the optics, and Pluto was not included in the mosaic because of its small size and distance from the Sun. These blown-up images, left to right and top to bottom are Venus, Earth, Jupiter, Saturn, Uranus, and Neptune. (Courtesy NASA/JPL)
The following table lists statistical information for the Sun and planets:
* The Sun's period of rotation at the surface varies from approximately 25 days at the equator to 36 days at the poles. Deep down, below the convective zone, everything appears to rotate with a period of 27 days.
Sun
The Sun is the most prominent feature in our solar system. It is the largest object and contains approximately 98% of the total solar system mass. One hundred and nine Earths would be required to fit across the Sun's disk, and its interior could hold over 1.3 million Earths. The Sun's outer visible layer is called the photosphere and has a temperature of 6,000°C (11,000°F). This layer has a mottled appearance due to the turbulent eruptions of energy at the surface.
Solar energy is created deep within the core of the Sun. It is here that the temperature (15,000,000° C; 27,000,000° F) and pressure (340 billion times Earth's air pressure at sea level) is so intense that nuclear reactions take place. This reaction causes four protons or hydrogen nuclei to fuse together to form one alpha particle or helium nucleus. The alpha particle is about .7 percent less massive than the four protons. The difference in mass is expelled as energy and is carried to the surface of the Sun, through a process known as convection, where it is released as light and heat. Energy generated in the Sun's core takes a million years to reach its surface. Every second 700 million tons of hydrogen are converted into helium ashes. In the process 5 million tons of pure energy is released; therefore, as time goes on the Sun is becoming lighter.
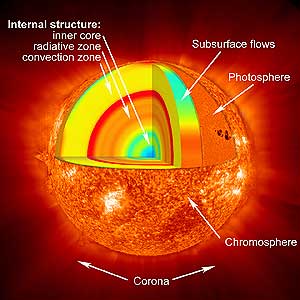
The chromosphere is above the photosphere. Solar energy passes through this region on its way out from the center of the Sun. Faculae and flares arise in the chromosphere. Faculae are bright luminous hydrogen clouds which form above regions where sunspots are about to form. Flares are bright filaments of hot gas emerging from sunspot regions. Sunspots are dark depressions on the photosphere with a typical temperature of 4,000°C (7,000°F).
The corona is the outer part of the Sun's atmosphere. It is in this region that prominences appears. Prominences are immense clouds of glowing gas that erupt from the upper chromosphere. The outer region of the corona stretches far into space and consists of particles traveling slowly away from the Sun. The corona can only be seen during total solar eclipses.
The Sun appears to have been active for 4.6 billion years and has enough fuel to go on for another five billion years or so. At the end of its life, the Sun will start to fuse helium into heavier elements and begin to swell up, ultimately growing so large that it will swallow the Earth. After a billion years as a red giant, it will suddenly collapse into a white dwarf -- the final end product of a star like ours. It may take a trillion years to cool off completely.
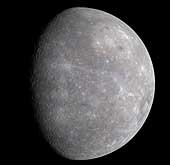
Mercury
Mercury was named by the Romans after the fleet-footed messenger of the gods because it seemed to move more quickly than any other planet. It is the closest planet to the Sun, and second smallest planet in the solar system. Its diameter is 40% smaller than Earth and 40% larger than the Moon. It is even smaller than Jupiter's moon Ganymede and Saturn's moon Titan.
If an explorer were to step onto the surface of Mercury, he would discover a world resembling lunar terrain. Mercury's rolling, dust-covered hills have been eroded from the constant bombardment of meteorites. Fault-cliffs rise for several kilometers in height and extend for hundreds of kilometers. Craters dot the surface. The explorer would notice that the Sun appears two and a half times larger than on Earth; however, the sky is always black because Mercury has virtually no atmosphere to cause scattering of light. As the explorer gazes out into space, he might see two bright stars. One appearing as cream colored Venus and the other as blue colored Earth.
Until Mariner 10, little was known about Mercury because of the difficulty in observing it from Earth telescopes. At maximum elongation it is only 28 degrees from the Sun as seen from Earth. Because of this, it can only be viewed during daylight hours or just prior to sunrise or after sunset. When observed at dawn or dusk, Mercury is so low on the horizon that the light must pass through 10 times the amount of Earth's atmosphere than it would if Mercury was directly overhead.
During the 1880's, Giovanni Schiaparelli drew a sketch showing faint features on Mercury. He determined that Mercury must be tidally locked to the Sun, just as the Moon is tidally locked to Earth. In 1962, radio astronomers looked at radio emissions from Mercury and determined that the dark side was too warm to be tidally locked. It was expected to be much colder if it always faced away from the Sun. In 1965, Pettengill and Dyce determined Mercury's period of rotation to be 59 +- 5 days based upon radar observations. Later in 1971, Goldstein refined the rotation period to be 58.65 +- 0.25 days using radar observations. After close observation by the Mariner 10 spacecraft, the period was determined to be 58.646 +- 0.005 days.
Although Mercury is not tidally locked to the Sun, its rotational period is tidally coupled to its orbital period. Mercury rotates one and a half times during each orbit. Because of this 3:2 resonance, a day on Mercury (sun rise to sun rise) is 176 Earth days long as shown by the following diagram.
During Mercury's distant past, its period of rotation may have been faster. Scientists speculate that its rotation could have been as rapid as 8 hours, but over millions of years it was slowly despun by solar tides. A model of this process shows that such a despinning would take 109 years and would have raised the interior temperature by 100 degrees Kelvin.
Most of the scientific findings about Mercury comes from the Mariner 10 spacecraft which was launched on November 3, 1973. It flew past the planet on March 29, 1974 at a distance of 705 kilometers from the surface. On September 21, 1974 it flew past Mercury for the second time and on March 16, 1975 for the third time. During these visits, over 2,700 pictures were taken, covering 45% of Mercury's surface. Up until this time, scientists did not suspect that Mercury would have a magnetic field. They thought that because Mercury is small, its core would have solidified long ago. The presence of a magnetic field indicates that a planet has an iron core that is at least partially molten. Magnetic fields are generated from the rotation of a conductive molten core and is known as the dynamo effect.
Mariner 10 showed that Mercury has a magnetic field that is 1% as strong as Earth's. This magnet field is inclined 7 degrees to Mercury's axis of rotation and produces a magnetosphere around the planet. The source of the magnetic field is unknown. It might be produced from a partially molten iron core in the planet's interior. Another source of the field might be from remnant magnetization of iron-bearing rocks which were magnetized when the planet had a strong magnetic field during its younger years. As the planet cooled and solidified remnant magnetization was retained.
Even before Mariner 10, Mercury was known to have a high density. Its density is 5.44 g/cm3 which is comparable to Earth's 5.52g/cm3 density. In an uncompressed state, Mercury's density is 5.5 g/cm3 where Earth's is only 4.0 g/cm3. This high density indicates that the planet is 60 to 70 percent by weight metal, and 30 percent by weight silicate. This gives a core radius of 75% of the planet radius and a core volume of 42% of the planet's volume.
The majority of Mercury's surface is covered by plains. Much of it is old and heavily cratered, but some of the plains are less heavily cratered. Scientists have classified these plains as intercrater plains and smooth plains. Intercrater plains are less saturated with craters and the craters are less than 15 kilometers in diameter. These plains were probably formed as lava flows buried the older terrain. The smooth plains are younger still with fewer craters. Smooth plains can be found around the Caloris basin. In some areas patches of smooth lava can be seen filling craters.
Mercury's history of formation is similar to that of Earth's. About 4.5 billion years ago the planets formed. This was a time of intense bombardment for the planets as they scooped up matter and debris left around from the nebula that formed them. Early during this formation, Mercury probably differentiated into a dense metallic core, and a silicate crust. After the intense bombardment period, lava flowed across the surface and covered the older crust. By this time much of the debris had been swept up and Mercury entered a lighter bombardment period. During this period the intercrater plains formed. Then Mercury cooled. Its core contracted which in turn broke the crust and produced the prominent lobate scarps. During the third stage, lava flooded the lowlands and produced the smooth plains. During the fourth stage micrometeorite bombardment created a dusty surface also known as regolith. A few larger meteorites impacted the surface and left bright rayed craters. Other than the occasional collisions of a meteorites, Mercury's surface is no longer active and remains the same as it has for millions of years.
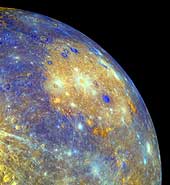
 Mercury Shows Its True Colors
MESSENGER's Wide Angle Camera (WAC), part of the Mercury Dual Imaging System (MDIS), is equipped with 11 narrow-band color filters. As the spacecraft receded from Mercury after making its closest approach on January 14, 2008, the WAC recorded a 3x3 mosaic covering part of the planet not previously seen by spacecraft. The color image shown here was generated by combining the mosaics taken through the WAC filters that transmit light at wavelengths of 1000 nanometers (infrared), 700 nanometers (far red), and 430 nanometers (violet). These three images were placed in the red, green, and blue channels, respectively, to create the visualization presented here. The human eye is sensitive only across the wavelength range from about 400 to 700 nanometers. Creating a false-color image in this way accentuates color differences on Mercury's surface that cannot be seen in black-and-white (single-color) images.
Color differences on Mercury are subtle, but they reveal important information about the nature of the planet's surface material. A number of bright spots with a bluish tinge are visible in this image. These are relatively recent impact craters. Some of the bright craters have bright streaks (called "rays" by planetary scientists) emanating from them. Bright features such as these are caused by the presence of freshly crushed rock material that was excavated and deposited during the highly energetic collision of a meteoroid with Mercury to form an impact crater. The large circular light-colored area in the upper right of the image is the interior of the Caloris basin. Mariner 10 viewed only the eastern (right) portion of this enormous impact basin, under lighting conditions that emphasized shadows and elevation differences rather than brightness and color differences. MESSENGER has revealed that Caloris is filled with smooth plains that are brighter than the surrounding terrain, hinting at a compositional contrast between these geologic units. The interior of Caloris also harbors several unusual dark-rimmed craters, which are visible in this image. The MESSENGER science team is working with the 11-color images in order to gain a better understanding of what minerals are present in these rocks of Mercury's crust. (Courtesy NASA/JHUAPL)
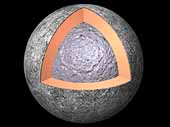 The Interior of Mercury
Most of what is known about the internal structure of Mercury comes from data acquired by the Mariner 10 spacecraft that flew past the planet in 1973 and 1974. Mercury is about a third of the size of Earth, yet its density is comparable to that of Earth. This indicates that Mercury has a large core roughly the size of Earth's moon or about 75% of the planet's radius. The core is likely composed of 60 to 70% iron by mass. Mariner 10's measurements of the planet reveals a dipolar magnetic field possibly produced by a partially molten core. A solid rocky mantle surrounds the core with a thin crust of about 100 kilometers. (Copyright Calvin J. Hamilton)
 Caloris Basin—in Color!
This false-color image of Mercury, recently published in Science magazine, shows the great Caloris impact basin, visible in this image as a large, circular, orange feature in the center of the picture. The contrast between the colors of the Caloris basin floor and those of the surrounding plains indicate that the composition of Mercury's surface is variable. Many additional geological features with intriguing color signatures can be identified in this image. For example, the bright orange spots just inside the rim of Caloris basin are thought to mark the location of volcanic features, such as the volcano shown in image PIA10942. MESSENGER Science Team members are studying these regional color variations in detail, to determine the different mineral compositions of Mercury's surface and to understand the geologic processes that have acted on it. Images taken through the 11 different WAC color filters were used to create this false-color image. The 11 different color images were compared and contrasted using statistical methods to isolate and enhance subtle color differences on Mercury's surface. (Courtesy NASA/Johns Hopkins University Applied Physics Laboratory/Arizona State)
 MESSENGER Discovers Volcanoes on Mercury
As reported in the July 4, 2008 issue of Science magazine, volcanoes have been discovered on Mercury's surface from images acquired during MESSENGER's first Mercury flyby. This image shows the largest feature identified as a volcano in the upper center of the scene. The volcano has a central kidney-shaped depression, which is the vent, and a broad smooth dome surrounding the vent. The volcano is located just inside the rim of the Caloris impact basin. The rim of the basin is marked with hills and mountains, as visible in this image. The role of volcanism in Mercury's history had been previously debated, but MESSENGER's discovery of the first identified volcanoes on Mercury's surface shows that volcanism was active in the distant past on the innermost planet. (Courtesy NASA/Johns Hopkins University Applied Physics Laboratory/Carnegie Institution of Washington)
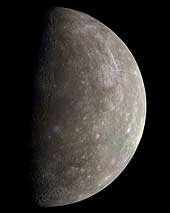
 Mercury - in Color!
One week ago, the MESSENGER spacecraft transmitted to Earth the first high-resolution image of Mercury by a spacecraft in over 30 years, since the three Mercury flybys of Mariner 10 in 1974 and 1975. MESSENGER's Wide Angle Camera (WAC), part of the Mercury Dual Imaging System (MDIS), is equipped with 11 narrow-band color filters, in contrast to the two visible-light filters and one ultraviolet filter that were on Mariner 10's vidicon camera. By combining images taken through different filters in the visible and infrared, the MESSENGER data allow Mercury to be seen in a variety of high-resolution color views not previously possible. MESSENGER's eyes can see far beyond the color range of the human eye, and the colors seen in the accompanying image are somewhat different from what a human would see.
The color image was generated by combining three separate images taken through WAC filters sensitive to light in different wavelengths; filters that transmit light with wavelengths of 1000, 700, and 430 nanometers (infrared, far red, and violet, respectively) were placed in the red, green, and blue channels, respectively, to create this image. The human eye is sensitive across only the wavelength range 400 to 700 nanometers. Creating a false-color image in this way accentuates color differences on Mercury's surface that cannot be seen in the single-filter, black-and-white image released last week.
This visible-infrared image shows an incoming view of Mercury, about 80 minutes before MESSENGER's closest pass of the planet on January 14, 2008, from a distance of about 27,000 kilometers (17,000 miles). (Courtesy NASA/JHUAPL)
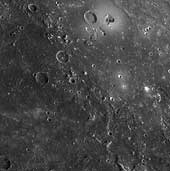
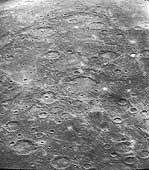
 Mercury's Complex Cratering History
On January 14, 2008, the MESSENGER spacecraft observed about half of the hemisphere not seen by Mariner 10. These images, mosaicked together by the MESSENGER team, were taken by the Narrow Angle Camera (NAC), part of the Mercury Dual Imaging System (MDIS) instrument, about 20 minutes after MESSENGER's closest approach to Mercury (2:04 pm EST), when the spacecraft was at a distance of about 5,000 kilometers (about 3,100 miles). The image shows features as small as 400 meters (0.25 miles) in size and is about 370 kilometers (230 miles) across.
The image shows part of a large, fresh crater with secondary crater chains located near Mercury's equator on the side of the planet newly imaged by MESSENGER. Large, flat-floored craters often have terraced rims from post-impact collapse of their newly formed walls. The hundreds of secondary impactors that are excavated from the planet's surface by the incoming object create long, linear crater chains radial to the main crater. These chains, in addition to the rest of the ejecta blanket, create the complicated, hilly terrain surrounding the primary crater. By counting craters on the ejecta blanket that have formed since the impact event, the age of the crater can be estimated. This count can then be compared with a similar count for the crater floor to determine whether any material has partially filled the crater since its formation. With their large size and production of abundant secondary craters, these flat-floored craters both illuminate and confound the study of the geological history of Mercury. (Courtesy NASA/JHUAPL)
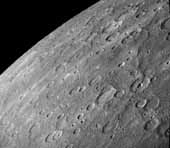
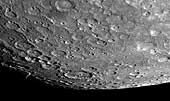 Looking Toward the South Pole of Mercury
On January 14, 2008, the MESSENGER spacecraft passed 200 kilometers (124 miles) above the surface of Mercury and snapped the first pictures of a side of Mercury not previously seen by spacecraft. This image shows that previously unseen side, with a view looking toward Mercury's south pole. The southern limb of the planet can be seen in the bottom right of the image. The bottom left of the image shows the transition from the sunlit, day side of Mercury to the dark, night side of the planet, a transition line known as the terminator. In the region near the terminator, the sun shines on the surface at a low angle, causing the rims of craters and other elevated surface features to cast long shadows, accentuating height differences in the image.
This image was acquired about 98 minutes after MESSENGER's closest approach to Mercury, when the spacecraft was at a distance of about 33,000 kilometers (21,000 miles). (Courtesy NASA/JHUAPL)
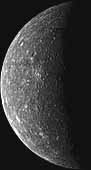
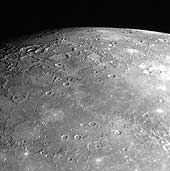 MESSENGER Looks to the North
As MESSENGER sped by Mercury on January 14, 2008, the Narrow Angle Camera (NAC) of the Mercury Dual Imaging System (MDIS) captured this shot looking toward Mercury's north pole. The surface shown in this image is from the side of Mercury not previously seen by spacecraft. The top right of this image shows the limb of the planet, which transitions into the terminator (the line between the sunlit, day side and the dark, night side) on the top left of the image. Near the terminator, the Sun illuminates surface features at a low angle, casting long shadows and causing height differences of the surface to appear more prominent in this region.
It is interesting to compare MESSENGER's view to the north with the image looking toward the south pole, released on January 21. Comparing these two images, it can be seen that the terrain near the south pole is more heavily cratered while some of the region near the north pole shows less cratered, smooth plains material, consistent with the general observations of the poles made by Mariner 10. MESSENGER acquired over 1200 images of Mercury's surface during its flyby, and the MESSENGER team is busy examining all of those images in detail, to understand the geologic history of the planet as a whole, from pole to pole. (Courtesy NASA/JHUAPL)
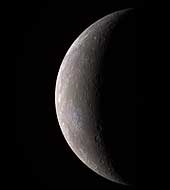
 Mariner 10 Outgoing Color Image of Mercury
This mosaic of Mercury was created from more than 140 images taken by the Mariner 10 spacecraft as it flew past the innermost planet on March 29, 1974. Mariner 10's trajectory brought the spacecraft across the dark hemisphere of Mercury. The images were acquired after the spacecraft exited Mercury's shadow. The color data is from more distant global views. (Copyright Ted Stryk)
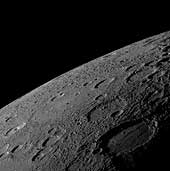 MESSENGER Views Mercury's Horizon
As the MESSENGER spacecraft drew closer to Mercury for its historic first flyby, the spacecraft's Narrow Angle Camera (NAC) on the Mercury Dual Imaging System (MDIS) acquired an image mosaic of the sunlit portion of the planet. This image is one of those mosaic frames and was acquired on January 14, 2008, 18:10 UTC, when the spacecraft was about 18,000 kilometers (11,000 miles) from the surface of Mercury, about 55 minutes before MESSENGER's closest approach to the planet.
The image shows a variety of surface textures, including smooth plains at the center of the image, many impact craters (some with central peaks), and rough material that appears to have been ejected from the large crater to the lower right. This large 200-kilometer-wide (about 120 miles) crater was seen in less detail by Mariner 10 more than three decades ago and was named Sholem Aleichem for the Yiddish writer. In this MESSENGER image, it can be seen that the plains deposits filling the crater's interior have been deformed by linear ridges. The shadowed area on the right of the image is the day-night boundary, known as the terminator. Altogether, MESSENGER acquired over 1200 images of Mercury, which the science team members are now examining in detail to learn about the history and evolution of the innermost planet. (Courtesy NASA/JHUAPL)
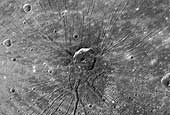 "The Spider" - Radial Troughs within Caloris
The Narrow Angle Camera of the Mercury Dual Imaging System (MDIS) on the MESSENGER spacecraft obtained high-resolution images of the floor of the Caloris basin on January 14, 2008. Near the center of the basin, an area unseen by Mariner 10, this remarkable feature - nicknamed "the spider" by the science team - was revealed. A set of troughs radiates outward in a geometry unlike anything seen by Mariner 10. The radial troughs are interpreted to be the result of extension (breaking apart) of the floor materials that filled the Caloris basin after its formation. Other troughs near the center form a polygonal pattern. This type of polygonal pattern of troughs is also seen along the interior margin of the Caloris basin. An impact crater about 40 km (~25 miles) in diameter appears to be centered on "the spider." The straight-line segments of the crater walls may have been influenced by preexisting extensional troughs, but some of the troughs may have formed at the time that the crater was excavated. (Courtesy NASA/JHUAPL)
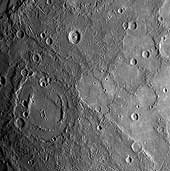 MESSENGER Reveals Mercury's Geological History
Shortly following MESSENGER's closest approach to Mercury on January 14, 2008, the spacecraft's Narrow Angle Camera (NAC) on the Mercury Dual Imaging System (MDIS) instrument acquired this image as part of a mosaic that covers much of the sunlit portion of the hemisphere not viewed by Mariner 10. Images such as this one can be read in terms of a sequence of geological events and provide insight into the relative timing of processes that have acted on Mercury's surface in the past.
The double-ringed crater pictured in the lower left of this image appears to be filled with smooth plains material, perhaps volcanic in nature. This crater was subsequently disrupted by the formation of a prominent scarp (cliff), the surface expression of a major crustal fault system, that runs alongside part of its northern rim and may have led to the uplift seen across a portion of the crater's floor. A smaller crater in the lower right of the image has also been cut by the scarp, showing that the fault beneath the scarp was active after both of these craters had formed. The MESSENGER team is working to combine inferences about the timing of events gained from this image with similar information from the hundreds of other images acquired by MESSENGER to extend and refine the geological history of Mercury previously defined on the basis only of Mariner 10 images. (Courtesy NASA/JHUAPL)
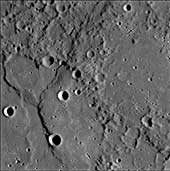 Ridges and Cliffs on Mercury's Surface
A complex history of geological evolution is recorded in this frame from the Narrow Angle Camera (NAC), part of the Mercury Dual Imaging System (MDIS) instrument, taken during MESSENGER's close flyby of Mercury on January 14, 2008. Part of an old, large crater occupies most of the lower left portion of the frame. An arrangement of ridges and cliffs in the shape of a "Y" crosses the crater's floor. The shadows defining the ridges are cast on the floor of the crater by the Sun shining from the right, indicating a descending stair-step of plains. The main, right-hand branch of the "Y" crosses the crater floor, the crater rim, and continues off the top edge of the picture; it appears to be a classic "lobate scarp" (irregularly shaped cliff) common in all areas of Mercury imaged so far. These lobate scarps were formed during a period when Mercury's crust was contracting as the planet cooled. In contrast, the branch of the Y to the left ends at the crater rim and is restricted to the floor of the crater. Both it and the lighter-colored ridge that extends downward from it resemble "wrinkle ridges" that are common on the large volcanic plains, or "maria," on the Moon. The MESSENGER science team is studying what features like these reveal about the interior cooling history of Mercury.
Ghostly remnants of a few craters are seen on the right side of this image, possibly indicating that once-pristine, bowl-shaped craters (like those on the large crater's floor) have been subsequently flooded by volcanism or some other plains-forming process. (Courtesy NASA/JHUAPL)
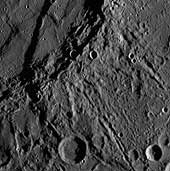 Detailed Close-up of Mercury's Previously Unseen Surface
This scene was imaged by MESSENGER's Narrow Angle Camera (NAC) on the Mercury Dual Imaging System (MDIS) during the spacecraft's flyby of Mercury on January 14, 2008. The scene is part of a mosaic that covers a portion of the hemisphere not viewed by Mariner 10 during any of its three flybys (1974-1975). The surface of Mercury is revealed at a resolution of about 250 meters/pixel (about 820 feet/pixel). For this image, the Sun is illuminating the scene from the top and north is to the left.
The outer diameter of the large double ring crater at the center of the scene is about 260 km (about 160 miles). The crater appears to be filled with smooth plains material that may be volcanic in nature. Multiple chains of smaller secondary craters are also seen extending radially outward from the double ring crater. Double or multiple rings form in craters with very large diameters, often referred to as impact basins. On Mercury, double ring basins begin to form when the crater diameter exceeds about 200 km (about 125 miles); at such an onset diameter the inner rings are typically low, partial, or discontinuous. The transition diameter at which craters begin to form rings is not the same on all bodies and, although it depends primarily on the surface gravity of the planet or moon, the transition diameter can also reveal important information about the physical characteristics of surface materials. Studying impact craters, such as this one, in the more than 1200 images returned from this flyby will provide clues to the physical properties of Mercury's surface and its geological history. (Courtesy NASA/JHUAPL)
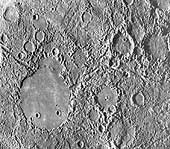 Hills of Mercury
"Weird terrain" best describes this hilly, lineated region of Mercury. This area is at the antipodal point from the large Caloris basin. The shock wave produced by the Caloris impact was reflected and focused to this antipodal point, thus jumbling the crust and breaking it into a series of complex blocks. The area covered is about 100 kilometers (62 miles) on a side. (Copyright Calvin J. Hamilton; FDS 27370)
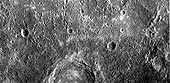
 Caloris Basin Floor
This image is a high resolution view of the Caloris Basin shown in the previous image. It shows ridges and fractures that increase in size towards the center of the basin (upper left). (Copyright Calvin J. Hamilton; FDS 126)
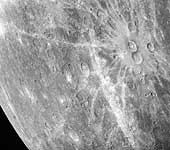 Bright Rayed Craters
This image shows two prominent craters (upper right) with bright halos on Mercury. The craters are about 40 kilometers (25 miles) in diameter. The halos and rays cover other features on the surface indicating that they are some of the youngest on Mercury. (Copyright Calvin J. Hamilton; FDS 275)
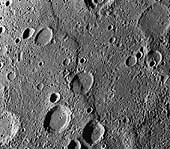 Large Faults on Mercury
This Mariner 10 image shows Santa Maria Rupes, the sinuous dark feature running through the crater at the center of this image. Many such features were discovered in the Mariner images of Mercury and are interpreted to be enormous thrust faults where part of the mercurian crust was pushed slightly over an adjacent part by compressional forces. The abundance and length of the thrust faults indicate that the radius of Mercury decreased by 1-2 kilometers (.6 - 1.2 miles) after the solidification and impact cratering of the surface. This volume change probably was due to the cooling of the planet, following the formation of a metallic core three-fourths the size of the planet. North is towards the top and is 200 kilometers (120 miles) across. (© Copyright 1998 by Calvin J. Hamilton; FDS 27448)
 Antoniadi Ridge
This is an image of a 450 kilometer (280 mile) ridge called Antoniadi. It travels along the right edge of the image, and transects a large 80 kilometer (50 mile) crater about half way in between. It crosses smooth plains to the north and intercrater plains to the south [Strom et al., 1975]. (Copyright Calvin J. Hamilton)
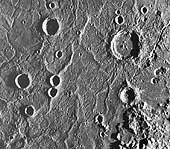
 Double Ring Basin
This image shows a double-ring basin which is 200 kilometers (120 miles) in diameter. The floor contains smooth plains material. The inner ring basin is at a lower elevation than the outer ring. (Copyright Calvin J. Hamilton; FDS 27301)
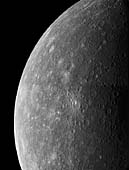
 Incoming View of Mercury
This photomosaic of Mercury was constructed from photos taken by Mariner 10 six hours before the spacecraft flew past the planet on March 29, 1974. These images were taken from a distance of 5,380,000 kilometers (3,340,000 miles). (Courtesy USGS, and NASA)
 Mercury
This two image (FDS 26850, 26856) mosaic of Mercury was constructed from photos taken by Mariner 10 a few hours before the spacecraft's closest and first encounter with the planet on March 29, 1974. (Copyright Calvin J. Hamilton)
 Caloris Basin
This mosaic shows the Caloris Basin (located half-way in shadow on the morning terminator). Caloris is Latin for heat and the basin is named this because it is near the subsolar point (the point closest to the sun) when Mercury is at aphelion. Caloris basin is 1,300 kilometers (800 miles) in diameter and is the largest know structure on Mercury. It was formed from an impact of a projectile with asteroid dimensions. The interior floor of the basin contains smooth plains but is highly ridged and fractured. North is towards the top of this image. (Copyright Calvin J. Hamilton; FDS 188-199)
Venus
Venus, the jewel of the sky, was once know by ancient astronomers as the morning star and evening star. Early astronomers once thought Venus to be two separate bodies. Venus, which is named after the Roman goddess of love and beauty, is veiled by thick swirling cloud cover.
Astronomers refer to Venus as Earth's sister planet. Both are similar in size, mass, density and volume. Both formed about the same time and condensed out of the same nebula. However, during the last few years scientists have found that the kinship ends here. Venus is very different from the Earth. It has no oceans and is surrounded by a heavy atmosphere composed mainly of carbon dioxide with virtually no water vapor. Its clouds are composed of sulfuric acid droplets. At the surface, the atmospheric pressure is 92 times that of the Earth's at sea-level.
Venus is scorched with a surface temperature of about 482° C (900° F). This high temperature is primarily due to a runaway greenhouse effect caused by the heavy atmosphere of carbon dioxide. Sunlight passes through the atmosphere to heat the surface of the planet. Heat is radiated out, but is trapped by the dense atmosphere and not allowed to escape into space. This makes Venus hotter than Mercury.
A Venusian day is 243 Earth days and is longer than its year of 225 days. Oddly, Venus rotates from east to west. To an observer on Venus, the Sun would rise in the west and set in the east.
Until just recently, Venus' dense cloud cover has prevented scientists from uncovering the geological nature of the surface. Developments in radar telescopes and radar imaging systems orbiting the planet have made it possible to see through the cloud deck to the surface below. Four of the most successful missions in revealing the Venusian surface are NASA's Pioneer Venus mission (1978), the Soviet Union's Venera 15 and 16 missions (1983-1984), and NASA's Magellan radar mapping mission (1990-1994). As these spacecraft began mapping the planet a new picture of Venus emerged.
Venus' surface is relatively young geologically speaking. It appears to have been completely resurfaced 300 to 500 million years ago. Scientists debate how and why this occurred. The Venusian topography consists of vast plains covered by lava flows and mountain or highland regions deformed by geological activity. Maxwell Montes in Ishtar Terra is the highest peak on Venus. The Aphrodite Terra highlands extend almost half way around the equator. Magellan images of highland regions above 2.5 kilometers (1.5 miles) are unusually bright, characteristic of moist soil. However, liquid water does not exist on the surface and cannot account for the bright highlands. One theory suggests that the bright material might be composed of metallic compounds. Studies have shown the material might be iron pyrite (also know as "fools gold"). It is unstable on the plains but would be stable in the highlands. The material could also be some type of exotic material which would give the same results but at lower concentrations.
Venus is scarred by numerous impact craters distrubuted randomly over its surface. Small craters less that 2 kilometers (1.2 miles) are almost non-existent due to the heavy Venusian atmosphere. The exception occurs when large meteorites shatter just before impact, creating crater clusters. Volcanoes and volcanic features are even more numerous. At least 85% of the Venusian surface is covered with volcanic rock. Hugh lava flows, extending for hundreds of kilometers, have flooded the lowlands creating vast plains. More than 100,000 small shield volcanoes dot the surface along with hundreds of large volcanos. Flows from volcanos have produced long sinuous channels extending for hundreds of kilometers, with one extending nearly 7,000 kilometers (4,300 miles).
Giant calderas more than 100 kilometers (62 miles) in diameter are found on Venus. Terrestrial calderas are usually only several kilometers in diameter. Several features unique to Venus include coronae and arachnoids. Coronae are large circular to oval features, encircled with cliffs and are hundreds of kilometers across. They are thought to be the surface expression of mantle upwelling. Archnoids are circular to elongated features similar to coronae. They may have been caused by molten rock seeping into surface fractures and producing systems of radiating dikes and fractures.
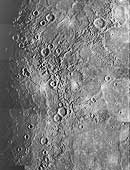
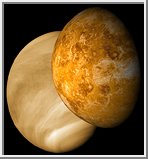 Venus with Visible and Radar Illumination
This picture shows two different perspectives of Venus. On the left is a mosaic of images acquired by the Mariner 10 spacecraft on February 5, 1974. The image shows the thick cloud coverage that prevents optical observation of the planet's surface. The surface of Venus remained hidden until 1978 when the Pioneer Venus 1 spacecraft arrived and went into orbit about the planet on December 4th. The spacecraft used radar to map planet's surface, revealing a new Venus. Later in August of 1990 the Magellan spacecraft arrived at Venus and began its extensive planetary mapping mission. This mission produced radar images up to 300 meters per pixel in resolution. The right image show a rendering of Venus from the Pioneer Venus and Magellan radar images. (Copyright Calvin J. Hamilton)
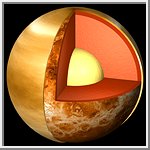 The Interior of Venus
This picture shows a cutaway view of the possible internal structure of Venus. The image was created from Mariner 10 images used for the outer atmospheric layer. The surface was taken from Magellan radar images. The interior characteristics of Venus are inferred from gravity field and magnetic field measurements by Magellan and prior spacecraft. The crust is shown as adark red, the mantle as a lighter orange-red, and the core yellow. More ... (Copyright Calvin J. Hamilton)
 Mariner 10 Image of Venus
This beautiful image of Venus is a mosaic of three images acquired by the Mariner 10 spacecraft on February 5, 1974. It shows the thick cloud coverage that prevents optical observation of the surface of Venus. Only through radar mapping is the surface revealed. (Copyright Calvin J. Hamilton)
 Galileo Image of Venus
On February 10, 1990 the Galileo spacecraft acquired this image of Venus. Only thick cloud cover can be seen. (Copyright Calvin J. Hamilton)
 Hubble Image of Venus
This is a Hubble Space Telescope ultraviolet-light image of the planet Venus, taken on January 24, 1995, when Venus was at a distance of 113.6 million kilometers from Earth. At ultraviolet wavelengths cloud patterns become distinctive. In particular, a horizontal "Y" shaped cloud feature is visible near the equator. The polar regions are bright, possibly showing a haze of small particles overlying the main clouds. The dark regions show the location of enhanced sulfur dioxide near the cloud tops. From previous missions, astronomers know that such features travel east to west along with the Venus' prevailing winds, to make a complete circuit around the planet in four days. (Credit: L. Esposito, University of Colorado, Boulder, and NASA)
 Hemispheric View of Venus
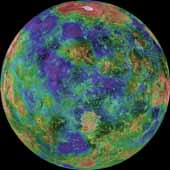
This hemispheric view of Venus, as revealed by more than a decade of radar investigations culminating in the 1990-1994 Magellan mission, is centered at 0 degrees east longitude. The effective resolution of this image is about 3 kilometers. It was processed to improve contrast and to emphasize small features, and was color-coded to represent elevation. (Courtesy NASA/USGS)
Additional Hemispheric Views of Venus
 Venusian Map
This image is a Mercator projection of Venusian topography. Many of the different regions have been labeled. The map extends from -66.5 to 66.5 degrees in latitude and starts at 240 degrees longitude. (Copyright Calvin J. Hamilton)
 Venusian Topography Map
This is another Mercator projection of Venusian topography. The map extends from -66.5 to 66.5 degrees in latitude and starts at 240 degrees longitude. A Black & White version of this image is also available. (Courtesy A.Tayfun Oner)
 Gula Mons and Crater Cunitz
A portion of Western Eistla Regio is displayed in this three dimensional perspective view of the surface of Venus. The viewpoint is located 1,310 kilometers (812 miles) southwest of Gula Mons at an elevation of 0.78 kilometers (0.48 mile). The view is to the northeast with Gula Mons appearing on the horizon. Gula Mons, a 3 kilometer (1.86 mile) high volcano, is located at approximately 22 degrees north latitude, 359 degrees east longitude. The impact crater Cunitz, named for the astronomer and mathematician Maria Cunitz, is visible in the center of the image. The crater is 48.5 kilometers (30 miles) in diameter and is 215 kilometers (133 miles) from the viewer's position. (Courtesy NASA/JPL)
 Eistla Regio - Rift Valley
A portion of Western Eistla Regio is displayed in this three dimensional perspective view of the surface of Venus. The viewpoint is located 725 kilometers (450 miles) southeast of Gula Mons. A rift valley, shown in the foreground, extends to the base of Gula Mons, a 3 kilometer (1.86 miles) high volcano. This view is facing the northwest with Gula Mons appearing at the right on the horizon. Sif Mons, a volcano with a diameter of 300 kilometers (180 miles) and a height of 2 kilometers (1.2 miles), appears to the left of Gula Mons in the background. (Courtesy NASA/JPL)
 Eistla Regio
A portion of Western Eistla Regio is displayed in this three dimensional perspective view of the surface of Venus. The viewpoint is located 1,100 kilometers (682 miles) northeast of Gula Mons at an elevation of 7.5 kilometers (4.6 miles). Lava flows extend for hundreds of kilometers across the fractured plains shown in the foreground, to the base of Gula Mons. This view faces the southwest with Gula Mons appearing at the left just below the horizon. Sif Mons appears to the right of Gula Mons. The distance between Sif Mons and Gula Mons is approximately 730 kilometers (453 miles). (Courtesy NASA/JPL)
 Lakshmi Planum
The southern scarp and basin province of western Ishtar Terra are portrayed in this three dimensional perspective view. Western Ishtar Terra is about the size of Australia and is a major focus of Magellan investigations. The highland terrain is centered on a 2.5 km to 4 km high (1.5 mi to 2.5 mi high) plateau called Lakshmi Planum which can be seen in the distance at the right. Here the surface of the plateau drops precipitously into the bounding lowlands, with steep slopes that exceed 5% over 50 km (30 mi). (Courtesy NASA/JPL)
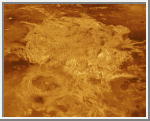 Three-Dimensional Perspective View of Alpha Regio
A portion of Alpha Regio is displayed in this three-dimensional perspective view of the surface of Venus. Alpha Regio, a topographic upland approximately 1300 kilometers across, is centered on 25 degrees south latitude, 4 degrees east longitude. In 1963, Alpha Regio was the first feature on Venus to be identified from earth-based radar. The radar-bright area of Alpha Regio is characterized by multiple sets of intersecting trends of structural features such as ridges, troughs, and flat-floored fault valleys that, together, form a polygonal outline. Directly south of the complex ridged terrain is a large ovoid-shaped feature named Eve. The radar-bright spot located centrally within Eve marks the location of the prime meridian of Venus. (Courtesy NASA/JPL)
 Arachnoids
Arachnoids are one of the more remarkable features found on Venus. They are seen on radar-dark plains in this Magellan image mosaic of the Fortuna region. As the name suggests, arachnoids are circular to ovoid features with concentric rings and a complex network of fractures extending outward. The arachnoids range in size from approximately 50 kilometers (29.9 miles) to 230 kilometers (137.7 miles) in diameter. Arachnoids are similar in form but generally smaller than coronae (circular volcanic structures surrounded by a set of ridges and grooves as well as radial lines). One theory concerning their origin is that they are a precursor to coronae formation. The radar-bright lines extending for many kilometers might have resulted from an upwelling of magma from the interior of the planet which pushed up the surface to form "cracks." Radar-bright lava flows are present in the 1st and 3rd image, also indicative of volcanic activity in this area. Some of the fractures cut across these flows, indicating that the flows occurred before the fractures appeared. Such relations between different structures provide good evidence for relative age dating of events. (Courtesy NASA/JPL)
 Parallel Lines
Two groups of parallel features that intersect almost at right angles are visible. The regularity of this terrain caused scientists to nickname it graph paper terrain. The fainter lineations are spaced at intervals of about 1 kilometer (.6 miles) and extend beyond the boundaries of the image. The brighter, more dominant lineations are less regular and often appear to begin and end where they intersect the fainter lineations. It is not yet clear whether the two sets of lineations represent faults or fractures, but in areas outside the image, the bright lineations are associated with pit craters and other volcanic features. (Courtesy Calvin J. Hamilton)
 Surface Photographs from Venera 9 and 10
The Soviet Venera 9 and 10 spacecraft were launched on 8 and 14 June 1975, respectively, to do the unprecedented: place landers on the surface of Venus and return images. The Venera 9 Lander (top) touched down on the surface of Venus on October 22, 1975 at 5:13 UT, about 32° S, 291° E with the sun near zenith. It operated for 53 minutes, allowing return of a single image. Venera 9 landed on a slope inclined by about 30 degrees to the horizontal. The white object at the bottom of the image is part of the lander. The distortion is caused by the Venera imaging system. Angular and partly weathered rocks, about 30 to 40 cm across, dominate the landscape, many partly buried in soil. The horizon is visible in the upper left and right corners. The Venera 10 Lander (bottom) touched down on the surface of Venus on October 25, 1975 at 5:17 UT, about 16° N, 291° E. The Lander was inclined about 8 degrees. It returned this image during the 65 minutes of operation on the surface. The sun was near zenith during this time, and the lighting was similar to that on Earth on an overcast summer day. The objects at the bottom of the image are parts of the spacecraft. The image shows flat slabs of rock, partly covered by fine-grained material, not unlike a volcanic area on Earth. The large slab in the foreground extends over 2 meters across.
 Color Surface Photographs from Venera 13
On March 1, 1982 the Venera 13 lander touched down on the Venusian surface at 7.5° S, 303° E, east of Phoebe Regio. It was the first Venera mission to include a color TV camera. Venera 13 survived on the surface for 2 hours, 7 minutes, long enough to obtain 14 images. This color panorama was produced using dark blue, green and red filters and has a resolution of 4 to 5 min. Part of the spacecraft is seen at the bottom of the image. Flat rock slabs and soil are visible. The true color is difficult to judge because the Venerian atmosphere filters out blue light. The surface composition is similar to terrestrial basalt. On the ground in the foreground is a camera lens cover. This image is the left half of the Venera 13 photo.
Earth
From the perspective we get on Earth, our planet appears to be big and sturdy with an endless ocean of air. From space, astronauts often get the impression that the Earth is small with a thin, fragile layer of atmosphere. For a space traveler, the distinguishing Earth features are the blue waters, brown and green land masses and white clouds set against a black background.
Many dream of traveling in space and viewing the wonders of the universe. In reality all of us are space travelers. Our spaceship is the planet Earth, traveling at the speed of 108,000 kilometers (67,000 miles) an hour.
Earth is the 3rd planet from the Sun at a distance of about 150 million kilometers (93.2 million miles). It takes 365.256 days for the Earth to travel around the Sun and 23.9345 hours for the Earth rotate a complete revolution. It has a diameter of 12,756 kilometers (7,973 miles), only a few hundred kilometers larger than that of Venus. Our atmosphere is composed of 78 percent nitrogen, 21 percent oxygen and 1 percent other constituents.
Earth is the only planet in the solar system known to harbor life. Our planet's rapid spin and molten nickel-iron core give rise to an extensive magnetic field, which, along with the atmosphere, shields us from nearly all of the harmful radiation coming from the Sun and other stars. Earth's atmosphere protects us from meteors, most of which burn up before they can strike the surface.
From our journeys into space, we have learned much about our home planet. The first American satellite, Explorer 1, discovered an intense radiation zone, now called the Van Allen radiation belts. This layer is formed from rapidly moving charged particles that are trapped by the Earth's magnetic field in a doughnut-shaped region surrounding the equator. Other findings from satellites show that our planet's magnetic field is distorted into a tear-drop shape by the solar wind. We also now know that our wispy upper atmosphere, once believed calm and uneventful, seethes with activity -- swelling by day and contracting by night. Affected by changes in solar activity, the upper atmosphere contributes to weather and climate on Earth.
Besides affecting Earth's weather, solar activity gives rise to a dramatic visual phenomenon in our atmosphere. When charged particles from the solar wind become trapped in Earth's magnetic field, they collide with air molecules above our planet's magnetic poles. These air molecules then begin to glow and are known as the auroras or the northern and southern lights.
The following set of images show some of the wonders of our planet, the Earth.
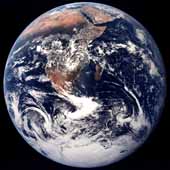
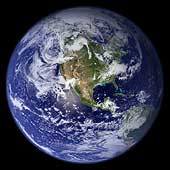 Blue Marble West
This spectacular "blue marble" image is the most detailed true-color image of the entire Earth to date. Using a collection of satellite-based observations, scientists and visualizers stitched together months of observations of the land surface, oceans, sea ice, and clouds into a seamless, true-color mosaic of every square kilometer (.386 square mile) of our planet. (Courtesy NASA/MODIS/USGS)
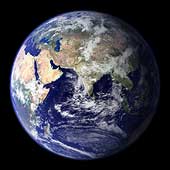 Blue Marble East
This spectacular "blue marble" image is the most detailed true-color image of the entire Earth to date. Using a collection of satellite-based observations, scientists and visualizers stitched together months of observations of the land surface, oceans, sea ice, and clouds into a seamless, true-color mosaic of every square kilometer (.386 square mile) of our planet. (Courtesy NASA/MODIS/USGS)
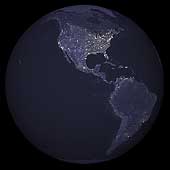 Earth Lights of North and South America
This image of North and South America city lights was created with data from the Defense Meteorological Satellite Program (DMSP) Operational Linescan System (OLS). Originally designed to view clouds by moonlight, the OLS is also used to map the locations of permanent lights on the Earth's surface.
The brightest areas of the Earth are the most urbanized, but not necessarily the most populated. Cities tend to grow along coastlines and transportation networks. Even without the underlying map, the outlines of the continents are still be visible. The United States interstate highway system appears as a lattice connecting the brighter dots of city centers. (Copyright Calvin J. Hamilton)
 Africa
The crew of Apollo 17 took this photograph of Earth in December 1972 while the spacecraft was traveling between the Earth and the Moon. The orange-red deserts of Africa and Saudi Arabia stand in stark contrast to the deep blue of the oceans and the white of both clouds and snow-covered Antarctica. (Courtesy NASA)
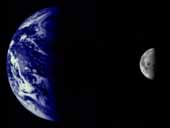 Mariner 10's View of the Earth & Moon
The Earth and Moon were imaged by Mariner 10 from 2.6 million kilometers while completing the first ever Earth-Moon encounter by a spacecraft capable of returning high resolution digital color image data. These images have been combined below to illustrate the relative sizes of the two bodies. From this particular viewpoint the Earth appears to be a water planet! (Courtesy NASA/JPL/Northwestern University)
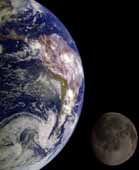 The Earth & Moon
During its flight, the Galileo spacecraft returned images of the Earth and Moon. Separate images of the Earth and Moon were combined to generate this view. The Galileo spacecraft took the images in 1992 on its way to explore the Jupiter system in 1995-97. The image shows a partial view of the Earth centered on the Pacific Ocean about latitude 20 degrees south. The west coast of South America can be observed as well as the Caribbean; swirling white cloud patterns indicate storms in the southeast Pacific. The distinct bright ray crater at the bottom of the Moon is the Tycho impact basin. The lunar dark areas are lava rock filled impact basins. This picture contains same scale and relative color/albedo images of the Earth and Moon. (Courtesy USGS/NASA)
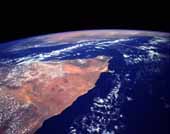
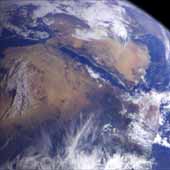 Northeast Africa and the Arabian Peninsula
This image of northeast Africa and the Arabian Peninsula was taken from an altitude of about 500,000 kilometers (300,000 miles) by the Galileo spacecraft on December 9, 1992, as it left Earth en route to Jupiter. Visible are most of Egypt (left of center), including the Nile Valley; the Red Sea (slightly above center); Israel; Jordan, and the Arabian Peninsula. In the center, below the coastal cloud, is Khartoum, at the confluence of the Blue Nile and the White Nile. Somalia (lower right) is partly covered by clouds. (Courtesy NASA/JPL)
 Horn of Africa, Somalia
The orange and tan colors of this high-oblique photograph of the Horn of Africa indicate an arid-to-semiarid landscape in the northern half of the east African country of Somalia. Except in the darker areas where thicker vegetation can be found, most of the vegetation in this part of Somalia is shrub brush and grasslands. The general climate of this region features hot temperatures and scarce, irregular rainfall. Two distinct drainage basins are characterized by lighter colors-the Nugaaleed Valley along the western side of the photograph and the other watershed trending toward the Hafun Peninsula, the tombolo along the east coast of Somalia. The southern extent of the Saudi Arabian Peninsula is visible north across the Gulf of Aden. (Courtesy NASA)
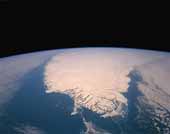 Southern Tip of Greenland
The southern tip of Greenland is seen in this high-oblique, almost colorless, stark photograph of the world's largest island. The blackness of space contrasts sharply with the whiteness of clouds, ice, and snow. The only true color is the blue of the Atlantic Ocean and the Labrador Sea. Cloud-free conditions existing along the southern coastal area emphasize the deeply indented fjords along the coast. A close look at the white areas reveals three different features-snow and ice on the land; cloud formations over the central region and the eastern and western sides of the island; and wispy-looking ice floes off the southeast and the southwest tip of the fjord-lined coast, which are moved by the East Greenland Current to the south-southwest, and larger ice packs developing north along the east coast. Greenland has the only surviving continental glacier in the Northern Hemisphere. This ice sheet covers seven-eighths of Greenland's surface and contains an estimated 11 percent of the world's fresh water. (Courtesy NASA)
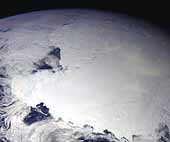 Antarctica
This image of Antarctica was taken by Galileo several hours after it flew close to the Earth on December 8, 1990. This is the first picture of the whole Antarctic continent taken nearly at once from space. Galileo was about 200,000 kilometers (125,000 miles) from Earth when the pictures were taken.
The icy continent is surrounded by the dark blue of three oceans: the Pacific to the left, the Indian to the bottom, and a piece of the Atlantic to the upper right. Nearly the entire continent was sunlit at this time of year, just two weeks before southern summer solstice. The arc of dark spots extending from near the South Pole (close to the center) toward the lower left is the Transantarctic Mountain Range. To the left of the mountains is the vast Ross Ice Shelf and the shelf's sharp border with the dark waters of the Ross Sea. The thin blue line along the Earth's limb marks our planet's atmosphere. (Courtesy NASA/JPL)
 Clementine Mission
This false-colored image was acquired during the Clementine mission. It shows airglow of the upper atmosphere as a thin blue line. The bright spot toward the bottom is an urban area. (Courtesy Naval Research Laboratory)
 Map projected image of Earth (AVHRR)
This image is a Homolosine projection of the Earth prepared from Advanced Very High Resolution Radiometer (AVHRR) image data. (Courtesy ESA/NASA/NOAA/USGS/CSIRO)
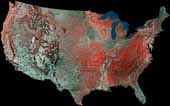 USA
USA
This image is a mosaic of the United States prepared by using 16 images from the Advanced Very High Resolution Radiometer (AVHRR) sensors on the meteorological satellites NOAA-8 and NOAA-9. The images were acquired between May 24, 1984 and May 14, 1986.
On false-color infrared mosaics, vegetation appears in various tones of red instead of green. The "redness" indicates vegetation density, type and whether growing on dry land or in a swamp (a mixture of reddish vegetation and dark blue surface water produces dark tones). Grasslands appear light red, deciduous trees and croplands appear red, and coniferous forests appear dark red or maroon. Desert areas appear white and urban areas (pavement and buildings) appear bluish green. Lakes, rivers and oceans appear in various shades of blue, dark blue for deep water and light blue for shallow or turbid water. Exposed bedrock generally appears as a dark bluish-green or other dark tone. (Courtesy USGS)
Mars
Mars is the fourth planet from the Sun and is commonly referred to as the Red Planet. The rocks, soil and sky have a red or pink hue. The distinct red color was observed by stargazers throughout history. It was given its name by the Romans in honor of their god of war. Other civilizations have had similar names. The ancient Egyptians named the planet Her Descher meaning the red one.
Before space exploration, Mars was considered the best candidate for harboring extraterrestrial life. Astronomers thought they saw straight lines crisscrossing its surface. This led to the popular belief that irrigation canals on the planet had been constructed by intelligent beings. In 1938, when Orson Welles broadcasted a radio drama based on the science fiction classic War of the Worlds by H.G. Wells, enough people believed in the tale of invading Martians to cause a near panic.
Another reason for scientists to expect life on Mars had to do with the apparent seasonal color changes on the planet's surface. This phenomenon led to speculation that conditions might support a bloom of Martian vegetation during the warmer months and cause plant life to become dormant during colder periods.
In July of 1965, Mariner 4, transmitted 22 close-up pictures of Mars. All that was revealed was a surface containing many craters and naturally occurring channels but no evidence of artificial canals or flowing water. Finally, in July and September 1976, Viking Landers 1 and 2 touched down on the surface of Mars. The three biology experiments aboard the landers discovered unexpected and enigmatic chemical activity in the Martian soil, but provided no clear evidence for the presence of living microorganisms in the soil near the landing sites. According to mission biologists, Mars is self-sterilizing. They believe the combination of solar ultraviolet radiation that saturates the surface, the extreme dryness of the soil and the oxidizing nature of the soil chemistry prevent the formation of living organisms in the Martian soil. The question of life on Mars at some time in the distant past remains open.
Other instruments found no sign of organic chemistry at either landing site, but they did provide a precise and definitive analysis of the composition of the Martian atmosphere and found previously undetected trace elements.
There is evidence that in the past a denser martian atmosphere may have allowed water to flow on the planet. Physical features closely resembling shorelines, gorges, riverbeds and islands suggest that great rivers once marked the planet.
Barometric pressure varies at each landing site on a semiannual basis. Carbon dioxide, the major constituent of the atmosphere, freezes out to form an immense polar cap, alternately at each pole. The carbon dioxide forms a great cover of snow and then evaporates again with the coming of spring in each hemisphere. When the southern cap was largest, the mean daily pressure observed by Viking Lander 1 was as low as 6.8 millibars; at other times of the year it was as high as 9.0 millibars. The pressures at the Viking Lander 2 site were 7.3 and 10.8 millibars. In comparison, the average pressure of the Earth is 1000 millibars.
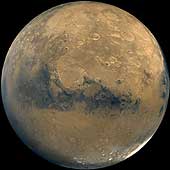
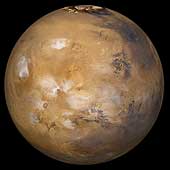 Mars With Cloud Cover
This image of mars came from a series of pictures taken by the Mars Global Surveyor wide angle cameras. A map was created and then wrapped around a sphere to generate this view of Mars. Here, bluish-white water ice clouds hang above the Tharsis volcanoes. (Copyright 2005 by Calvin J. Hamilton)
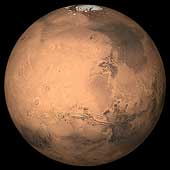 Large Mosaic of Mars
This image is a large mosaic of the Valles Marineris [VAL-less mar-uh-NAIR-iss] hemisphere of Mars. It is a view similar to that which one would see from a spacecraft. The lower center of the scene shows the entire Valles Marineris canyon system, more than 3,000 kilometers (1,860 miles) long and up to 8 kilometers (5 miles) deep, extending from Noctis Labyrinthus, the arcuate system of graben to the west, to the chaotic terrain to the east. Many huge ancient river channels begin from the chaotic terrain and north-central canyons and run north. Many of the channels flowed into a basin called Acidalia Planitia, which is the dark area in the extreme north of this picture. The three Tharsis volcanoes (dark red spots), each about 25 kilometers (16 miles) high, are visible to the west along with Olympus Mons the largest volcano on the planet. Very ancient terrain covered by many impact craters lies to the south of Valles Marineris. The polar cap can be seen to the north. (Copyright Calvin J. Hamilton)
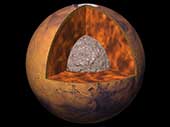 The Interior of Mars
The current understanding of the interior of Mars suggests that it can be modeled with a thin crust, similar to Earth's, a mantle and a core. Using four parameters, the Martian core size and mass can be determined. However, only three out of the four are known and include the total mass, size of Mars, and the moment of inertia. Mass and size was determined accurately from early missions. The moment of inertia was determined from Viking lander and Pathfinder Doppler data, by measuring the precession rate of Mars. The fourth parameter, needed to complete the interior model, will be obtained from future spacecraft missions. With the three known parameters, the model is significantly constrained. If the Martian core is dense (composed of iron) similar to Earth's or SNC meteorites thought to originate from Mars, then the minimum core radius would be about 1300 kilometers. If the core is made out of less-dense material such as a mixture of sulfur and iron, the maximum radius would probably be less than 2000 kilometers. (Copyright 1998 by Calvin J. Hamilton)
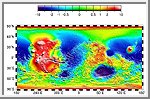 Topography Map of Mars
This image is a newly released topographic map of Mars. The full range of topography on Mars is about 19 miles (30 kilometers), one and a half times the range of elevations found on Earth, The most curious aspect of the map is the striking difference between the planet's low, smooth Northern Hemisphere and the heavily cratered Southern Hemisphere," which sits, on average, about three miles (five kilometers) higher than the north. (Courtesy GSFC/NASA)
 Schiaparelli Hemisphere
This image is a mosaic of the Schiaparelli hemisphere of Mars. The center of this image is near the impact crater Schiaparelli, 450 kilometers (280 miles) in diameter. The dark streaks with bright margins emanating from craters in the Oxie Palus region, upper left of image, are caused by erosion and/or deposition by the wind. Bright white areas to the south, including the Hellas impact basin at extreme lower right, are covered by carbon dioxide frost. (Courtesy USGS)
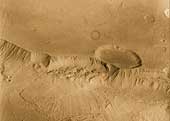
 Central Candor Chasm - Oblique View
This image shows part of Candor Chasm in Valles Marineris. It is centered at Latitude -5.0, Longitude 70.0. The view is from the north looking into the chasm. Candor Chasm's geomorphology is complex, shaped by tectonics, mass wasting, wind, and perhaps by water and volcanism. (Courtesy USGS)
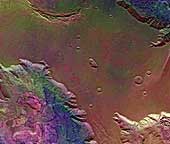 West Candor Chasm (Enhanced Color)
This picture (centered at latitude 4° S, longitude 76° W) shows areas of central Valles Marineris, including Candor Chasm (lower left), Ophir Chasm (lower right), and Hebes Chasm (upper right). Complex layered deposits in the canyons may have been deposited in lakes, and if so, are of great interest for future searches for fossil life on Mars. The pinkish deposits in Candor Chasm may be due to hydrothermal alterations and the production of crystalline ferric oxides. ((Geissler et al., 1993, Icarus 106,380). Viking Orbiter Picture Numbers 279B02 (violet), 279B10 (green), and 279B12 (red) at 240 meters/pixel resolution. Picture width is 231 kilometers. North is 47° clockwise from top.)
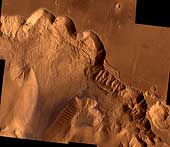 Ophir Chasma
Ophir Chasma is a large west-northwest-trending trough about 100 km wide. The Chasma is bordered by 4 km high walled cliffs, most likely faults, that show spur-and-gully morphology and smooth sections. The walls have been dissected by landslides forming reentrants; one area (upper left) on the north wall shows a young landslide about 100 km wide. The volume of the landslide debris is more than 1000 times greater than that from the May 18, 1980 debris avalanche from Mount St. Helens. The longitudinal grooves seen in the foreground are thought to be due to differential shear and lateral spreading at high velocities. The landslide passes between mounds of interior layered deposits on the floor of the chasma. (Courtesy USGS)
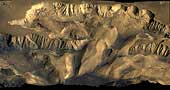
 Landslide in Valles Marineris
Although Valles Marineris originated as a tectonic structure, it has been modified by other processes. This image shows a close-up view of a landslide on the south wall of Valles Marineris. This landslide partially removed the rim of the crater that is on the plateau adjacent to Valles Marineris. Note the texture of the landslide deposit where it flowed across the floor of Valles Marineris. Several distinct layers can be seen in the walls of the trough. These layers may be regions of distinct chemical composition or mechanical properties in the Martian crust. (Copyright Calvin J. Hamilton; Caption: LPI)
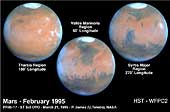 HST 3 Views of Mars at Opposition
These Hubble Space Telescope views provide the most detailed complete global coverage of the Red Planet ever seen from Earth. The pictures were taken on February 25, 1995, when Mars was at a distance of 103 million kilometers (65 million miles). To the surprise of researchers, Mars is cloudier than seen in previous years. This means the planet is cooler and drier, because water vapor in the atmosphere freezes out to form ice-crystal clouds. The three images show the Tharsis, Valles Marineris and Syrtis Major regions. (Credit: Philip James, University of Toledo; Steven Lee, University of Colorado; and NASA)
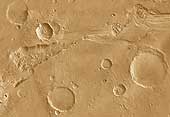 Outflow Source of Channel Ravi Vallis
This image of the head of Ravi Vallis shows a 300-kilometer (186-mile) long portion of a channel. Like many other channels that empty into the northern plains of Mars, Ravi Vallis orginates in a region of collapsed and disrupted ("chaotic") terrain within the planet's older, cratered highlands. Structures in these channels indicate that they were carved by liquid water moving at high flow rates. The abrupt beginning of the channel, with no apparent tributaries, suggests that the water was released under great pressure from beneath a confining layer of frozen ground. As this water was released and flowed away, the overlying surface collapsed, producing the disruption and subsidence shown here. Three such regions of chaotic collapsed material are seen in this image, connected by a channel whose floor was scoured by the flowing water. The flow in this channel was from west to east (left to right). This channel ultimately links up with a system of channels that flowed northward into Chryse Basin. (Copyright Calvin J. Hamilton; Caption: LPI)
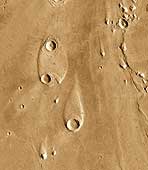 Streamlined Islands
The water that carved the channels to the north and east of the Valles Marineris canyon system had tremendous erosive power. One consequence of this erosion was the formation of streamlined islands where the water encountered obstacles along its path. This image shows two streamlined islands that formed as the water was diverted by two 8-10 kilometer (5-6 mile) diameter craters lying near the mouth of Ares Vallis in Chryse Planitia. The water flowed from south to north (bottom to top of the image). The height of the scarp surrounding the upper island is about 400 meters (1,300 feet), while the scarp surrounding the southern island is about 600 meters (2,000 feet) high. (Copyright Calvin J. Hamilton; Caption: LPI)
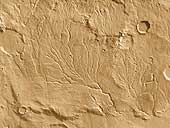 Valley Network
Unlike the features shown in the above two images, many systems on Mars do not show evidence of catastrophic flooding. Instead, they show a resemblance to drainage systems on Earth, where water acts at slow rates over long periods of time. As on Earth, the channels shown here merge together to form larger channels.
However, these valley networks are less developed than typical terrestrial drainage systems, with the Martian examples lacking small-scale streams feeding into the larger valleys. Because of the absence of small-scale streams in the Martian valley networks, it is thought that the valleys were carved primarily by ground water flow rather than by runoff of rain. Although liquid water is currently unstable on the surface of Mars, theoretical studies indicate that flowing groundwater might be able to form valley networks if the water flowed beneath a protective cover of ice. Alternatively, because the valley networks are confined to relatively old regions of Mars, their presence may indicate that Mars once possessed a warmer and wetter climate in its early history. (Copyright Calvin J. Hamilton; Caption: LPI)
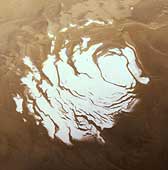 South Polar Cap
This image shows the south polar cap of Mars as it appears near its minimum size of about 400 kilometers (249 miles). It consists mainly of frozen carbon dioxide. This carbon dioxide cap never melts completely. The ice appears reddish due to dust that has been incorporated into the cap. (Courtesy NASA)
 North Polar Cap
This image is an oblique view of the north polar cap of Mars. Unlike the south polar cap, the north polar cap probably consists of water-ice. (Copyright Calvin J. Hamilton)
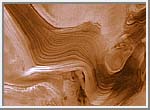 Polar Laminated Terrain
One of the discoveries of the Mariner 9 spacecraft was that the south polar cap of Mars was made of thin layers or laminations of ice and sediment. Four years later, on October 10, 1976, the Viking 2 spacecraft took this picture of the Martian north polar cap. The visible layering occurred as a result of wind born dust settling upon the polar cap. As the caps experience climatic variations, they expand and contract. The layers of dust sediment tend to grow thicker near the poles where ice deposits remain for longer periods of time. The thickness of the deposits indicates they were formed during cyclical climatic variation rather than annual changes. As ice withdraws from a region, wind exposes the layers sculpting valleys and scarps. The formation of layered deposits is an active process today. (Copyright 1998 by Calvin J. Hamilton)
 Dunefield
This image shows several dune types which are found in the north circumpolar dunefield. This thumnail image shows a section of transverse dunes. The full image has a field of traverse dunes on the left and barchan dunes on the right with a transition zone inbetween. Transverse dunes are oriented perpendicular to the prevailing wind direction. They are long and linear, and frequently join their neighbor in a low-angle "Y" junction. Barchan dunes are crescent-shaped mounds with downwind-pointing horns. These dunes are comparable in size to the largest dunes found on the Earth. (Copyright Calvin J. Hamilton)
 Local Dust Storm
Local dust storms are relatively common on Mars. They tend to occur in areas of high topographic and/or high thermal gradients (usually near the polar caps), where surface winds would be strongest. This storm is several hundreds of kilometers in extent and is located near the edge of the south polar cap. Some local storms grow larger, others die out. (Copyright Calvin J. Hamilton; caption by LPI)
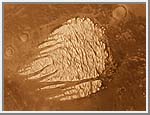 White Rock
This image shows a lesser known, but unusual feature on Mars. It is commonly called "White Rock". The white feature is eroded crater fill, but exactly how it was formed has not been satisfactorily explained. White Rock was not formed by polar processes because it lies near to the equator at latitude -8 degrees and longitude 355 degrees. It has been modified through aeolian erosion showing transverse and longitudinal erosional features. (Copyright 1998 by Calvin J. Hamilton)
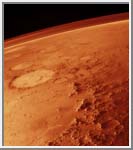 Martian Atmosphere
This oblique image taken by the Viking orbiter spacecraft shows a thin band of the Martian atmosphere. This image looks northeast across the Argyre basin. The Argyre basin is about 600 kilometers across with a rugged rim of about 500 kilometers in width. (Copyright 1997 by Calvin J. Hamilton)
The following table summarizes the radius, mass, distance from the planet center, discoverer and the date of discovery of each of the moons of Mars:
Jupiter
Jupiter is the fifth planet from the Sun and is the largest planet in the solar system. If Jupiter were hollow, more than one thousand Earths could fit inside. It also contains two and a half times the mass of all the other planets combined. It has a mass of 1.9 x 1027 kg and is 142,800 kilometers (88,736 miles) across the equator. Jupiter possesses 62 known satellites. The four largest are Callisto, Europa, Ganymede and Io, and were named after Galileo Galilei who observed them as long ago as 1610. The German astronomer Simon Marius claimed to have seen the moons around the same time, but he did not publish his observations and so Galileo is given the credit for their discovery.
Jupiter has a very faint ring system, but is totally invisible from the Earth. (The rings were discovered in 1979 by Voyager 1.) The atmosphere is very deep, perhaps comprising the whole planet, and is somewhat like the Sun. It is composed mainly of hydrogen and helium, with small amounts of methane, ammonia, water vapor and other compounds. At great depths within Jupiter, the pressure is so great that the hydrogen atoms are broken up and the electrons are freed so that the resulting atoms consist of bare protons. This produces a state in which the hydrogen becomes metallic.
Colorful latitudinal bands, atmospheric clouds and storms illustrate Jupiter's dynamic weather systems. The cloud patterns change within hours or days. The Great Red Spot is a complex storm moving in a counter-clockwise direction. At the outer edge, material appears to rotate in four to six days; near the center, motions are small and nearly random in direction. An array of other smaller storms and eddies can be found through out the banded clouds.
Auroral emissions, similar to Earth's northern lights, were observed in the polar regions of Jupiter. The auroral emissions appear to be related to material from Io that spirals along magnetic field lines to fall into Jupiter's atmosphere. Cloud-top lightning bolts, similar to superbolts in Earth's high atmosphere, were also observed.
The innermost halo ring is toroidal in shape and extends radially from about 92,000 kilometers (57,000 miles) to about 122,500 kilometers (76,000 miles) from Jupiter's center. It is formed as fine particles of dust from the main ring's inner boundary 'bloom' outward as they fall toward the planet. The main and brightest ring extends from the halo boundary out to about 128,940 kilometers (80,000 miles) or just inside the orbit of Adrastea. Close to the orbit of Metis, the main ring's brightness decreases.
The two faint Gossamer rings are fairly uniform in nature. The innermost Amalthea Gossamer ring extends from the orbit of Adrastea out to the orbit of Amalthea at 181,000 kilometers (112,000 miles) from Jupiter's center. The fainter Thebe Gossamer ring extends from Amalthea's orbit out to about Thebe's orbit at 221,000 kilometers (136,000 miles).
Jupiter's rings and moons exist within an intense radiation belt of electrons and ions trapped in the planet's magnetic field. These particles and fields comprise the jovian magnetosphere or magnetic environment, which extends 3 to 7 million kilometers (1.9 to 4.3 million miles) toward the Sun, and stretches in a windsock shape at least as far as Saturn's orbit - a distance of 750 million kilometers (466 million miles).
 Jupiter
This image was taken by NASA's Hubble Space Telescope on February 13, 1995. The image provides a detailed look at a unique cluster of three white oval-shaped storms that lie southwest (below and to the left) of Jupiter's Great Red Spot. The appearance of the clouds, in this image, is considerably different from their appearance only seven months earlier. These features are moving closer together as the Great Red Spot is carried westward by the prevailing winds while the white ovals are swept eastward.
The outer two of the white storms formed in the late 1930s. In the centers of these cloud systems the air is rising, carrying fresh ammonia gas upward. New, white ice crystals form when the upwelling gas freezes as it reaches the chilly cloud top level where temperatures are -130°C (-200°F). The intervening white storm center, the ropy structure to the left of the ovals, and the small brown spot have formed in low pressure cells. The white clouds sit above locations where gas is descending to lower, warmer regions.
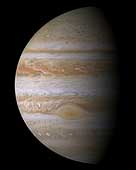 Cassini Jupiter Portrait
This true color mosaic of Jupiter was constructed from images taken by the Cassini spacecraft on December 29, 2000, during its closest approach to the giant planet at a distance of approximately 10 million kilometers (6.2 million miles).
It is the most detailed global color portrait of Jupiter ever produced; the smallest visible features are approximately 60 kilometers (37 miles) across. The mosaic is composed of 27 images: nine images were required to cover the entire planet in a tic-tac-toe pattern, and each of those locations was imaged in red, green, and blue to provide true color. Although Cassini's camera can see more colors than humans can, Jupiter's colors in this new view look very close to the way the human eye would see them.
Everything visible on the planet is a cloud. The parallel reddish-brown and white bands, the white ovals, and the large Great Red Spot persist over many years despite the intense turbulence visible in the atmosphere. The most energetic features are the small, bright clouds to the left of the Great Red Spot and in similar locations in the northern half of the planet. These clouds grow and disappear over a few days and generate lightning. Streaks form as clouds are sheared apart by Jupiter's intense jet streams that run parallel to the colored bands. The prominent dark band in the northern half of the planet is the location of Jupiter's fastest jet stream, with eastward winds of 480 kilometers (300 miles) per hour. Jupiter's diameter is eleven times that of Earth, so the smallest storms on this mosaic are comparable in size to the largest hurricanes on Earth.
Unlike Earth, where only water condenses to form clouds, Jupiter's clouds are made of ammonia, hydrogen sulfide, and water. The updrafts and downdrafts bring different mixtures of these substances up from below, leading to clouds at different heights. The brown and orange colors may be due to trace chemicals dredged up from deeper levels of the atmosphere, or they may be byproducts of chemical reactions driven by ultraviolet light from the Sun. Bluish areas, such as the small features just north and south of the equator, are areas of reduced cloud cover, where one can see deeper. (Courtesy NASA/JPL/Space Science Institute)
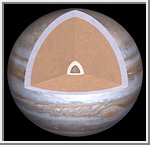 The Interior of Jupiter
This picture illustrates the internal structure of Jupiter. The outer layer is primarily composed of molecular hydrogen. At greater depths the hydrogen starts resembling a liquid. At 10,000 kilometers below Jupiter's cloud top liquid hydrogen reaches a pressure of 1,000,000 bar with a temperature of 6,000° K. At this state hydrogen changes into a phase of liquid metallic hydrogen. In this state, the hydrogen atoms break down yeilding ionized protons and electrons similar to the Sun's interior. Below this is a layer dominated by ice where "ice" denotes a soupy liquid mixture of water, methane, and ammonia under high temperatures and pressures. Finally at the center is a rocky or rocky-ice core of up to 10 Earth masses. (Copyright Calvin J. Hamilton)
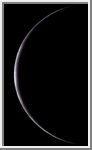 Thin Crescent Image of Jupiter
This thin crescent picture of Jupiter was created from a photomosaic of images Galileo took on its C9 orbit. It is made from Near Infrared and Violet images, with an artificial green image produced from the other two. (Courtesy of Ted Stryk)
 Nordic Optical Telescope
This image of Jupiter was taken with the 2.6 meter Nordic Optical Telescope, located at La Palma, Canary Islands. It is a good example of the best imagery that can be obtained from earth based telescopes. (c) Nordic Optical Telescope Scientific Association (NOTSA).
 Jupiter with Satellites Io and Europa
Voyager 1 took this photo of Jupiter and two of its satellites (Io, left, and Europa, right) on Feb. 13, 1979. In this view, Io is about 350,000 kilometers (220,000 miles) above Jupiter's Great Red Spot, while Europa is about 600,000 kilometers (373,000 miles) above Jupiter's clouds. Jupiter is about 20 million kilometers (12.4 million miles) from the spacecraft at the time of this photo. There is evidence of circular motion in Jupiter's atmosphere. While the dominant large scale motions are west-to-east, small scale movement includes eddy like circulation within and between the bands. (Courtesy NASA/JPL)
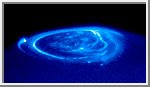 Satellite Footprints Seen in Jupiter Aurora
In this Hubble Space Telescope picture, a curtain of glowing gas is wrapped around Jupiter's north pole like a lasso. This curtain of light, called an aurora, is produced when high-energy electrons race along the planet's magnetic field and into the upper atmosphere where they excite atmospheric gases, causing them to glow. The aurora resembles the same phenomenon that crowns Earth's polar regions. But this Hubble image, taken in ultraviolet light, also shows the glowing "footprints" of three of Jupiter's largest moons: Io, Ganymede, and Europa.
Courtesy of NASA/ESA, John Clarke (University of Michigan)
 Jupiter's Magnetosphere
This image taken by the ion and neutral mass spectrometer instrument on NASA's Cassini spacecraft makes the huge magnetosphere surrounding Jupiter visible in a way no instrument on any previous spacecraft has been able to do. The magnetosphere is a bubble of charged particles trapped within the magnetic environment of the planet. A magnetic field is sketched over the image to place the energetic neutral atom emissions in perspective. This sketch extends in the horizontal plane to a width 30 times the radius of Jupiter. Also shown for scale and location are the disk of Jupiter (black circle) and the approximate position (yellow circles) of the doughnut-shaped torus created from material spewed out by volcanoes on Io.
Some of the fast-moving ions within the magnetosphere pick up electrons to become neutral atoms, and once they become neutral, they can escape Jupiter's magnetic field, flying out from the magnetosphere at speeds of thousands of kilometers, or miles, per second.
 Jupiter's Auroras
These HST images, reveal changes in Jupiter's auroral emissions and how small auroral spots just outside the emission rings are linked to the planet's volcanic moon, Io. The top panel pinpoints the effects of emissions from Io. The image on the left, shows how Io and Jupiter are linked by an invisible electrical current of charged particles called a flux tube. The particles, ejected from Io by volcanic eruptions, flow along Jupiter's magnetic field lines, which thread through Io, to the planet's north and south magnetic poles.
The top-right image shows Jupiter's auroral emissions at the north and south poles. Just outside these emissions are the auroral spots called "footprints." The spots are created when the particles in Io's "flux tube" reach Jupiter's upper atmosphere and interact with hydrogen gas, making it fluoresce.
The two ultraviolet images at the bottom of the picture show how the auroral emissions change in brightness and structure as Jupiter rotates. These false-color images also reveal how the magnetic field is offset from Jupiter's spin axis by 10 to 15 degrees. In the right image, the north auroral emission is rising over the left limb; the south auroral oval is beginning to set. The image on the left, obtained on a different date, shows a full view of the north aurora, with a strong emission inside the main auroral oval.
Credits: John T. Clarke and Gilda E. Ballester (University of Michigan), John Trauger and Robin Evans (Jet Propulsion Laboratory), and NASA.
 The Great Red Spot
This dramatic view of Jupiter's Great Red Spot and its surroundings was obtained by Voyager 1 on Feb. 25, 1979, when the spacecraft was 9.2 million kilometers (5.7 million miles) from Jupiter. Cloud details as small as 160 kilometers (100 miles) across can be seen here. The colorful, wavy cloud pattern to the left of the Red Spot is a region of extraordinarily complex and variable wave motion. (Courtesy NASA)
 False Color of Jupiter's Great Red Spot
This image is a false color representation of Jupiter's Great Red Spot taken with Galileo's imaging system through three different near-infrared filters. This is a mosaic of eighteen images (6 in each filter) that were taken over a period of 6 minutes on June 26, 1996. The Great Red Spot appears pink and the surrounding region blue because of the particular color coding used in this representation. The red channel is the reflectance of Jupiter at a wavelength where methane strongly absorbs (889nm). Because of this absorption, only high clouds can reflect sunlight in this wavelength. The green channel is the reflectance in a wavelength where methane absorbs, but less strongly (727nm). Lower clouds can reflect sunlight in this wavelength. Finally, the blue channel is the reflectance in a wavelength where there are essentially no absorbers in the Jovian atmosphere (756nm) and one sees light reflected from the deepest clouds. Thus, the color of a cloud in this image indicates its height, with red or white being highest and blue or black being lowest. This image shows the Great Red Spot to be relatively high, as are some smaller clouds to the northeast and northwest that are surprisingly like towering thunderstorms found on earth. The deepest clouds are in the collar surrounding the Great Red Spot, and also just to the northwest of the high (bright) cloud in the northwest corner of the image. Preliminary modelling shows these cloud heights to range about 50km in altitude. (Courtesy NASA/JPL)
 Ring of Jupiter
The ring of Jupiter was discovered by Voyager 1 in March of 1979. This image was taken by Voyager 2 and has been pseudo colored. The Jovian ring is about 6,500 kilometers (4,000 miles) wide and probably less than 10 kilometers (6.2 miles) thick. (Copyright Calvin J. Hamilton)
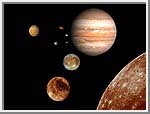 The Jovian System
The best of the Jupiter system is pictured in this collage of images acquired by the Voyager and Galileo spacecraft. Jupiter is the largest planet in our solar system. The four largest moons of Jupiter are known as the Galilean moons and are named Callisto, Ganymede, Europa, and Io. Inside the orbits of the Galilean moons are Thebe, Amalthea, Adrastea, and Metis. At the lower right is shown the Valhalla region of Callisto. Ganymede is toward the bottom middle. Europa is a little above and to the right of Ganymede. Io is the top, left-most moon. Between Io and Jupiter are four little moons. The top-most little moon is Amalthea. Below and to the right of Amalthea are Metis and Adrastea. To the left of Adrastea is Thebe. (Copyright Calvin J. Hamilton)
 Moons of Jupiter
This image shows to scale Jupiter's moons Amalthea, Io, Europa, Ganymede, and Callisto. (Copyright Calvin J. Hamilton)
*The distance is measured from the planet center to the start of the ring. Nearly four centuries ago Galileo Galilei turned his homemade telescope towards the heavens and discovered three points of light, which at first he thought to be stars, hugging the planet Jupiter. These stars were arranged in a straight line with Jupiter. Sparking his interest, Galileo observed the stars and found that they moved the wrong way. Four days later another star appeared. After observing the stars over the next few weeks, Galileo concluded that they were not stars but planetary bodies in orbit around Jupiter. These four stars have come to be know as the Galilean satellites.
Over the course of the following centuries another 12 moons were discovered bringing the total to 16. During the last few years the total number of satellites that have discovered is 62. Provisional designators are given until they are officially confirmed and named. Finally in 1979, the strangeness of these frozen new worlds was brought to light by the Voyager spacecrafts as they swept past the Jovian system. Again in 1996, the exploration of these worlds took a large step forward as the Galileo spacecraft began its long term mission of observing Jupiter and its moons.
Most of Jupiter's moons are relatively small and seem to have been more likely captured than to have been formed in orbit around Jupiter. The four large Galilean moons, Io, Europa, Ganymede and Callisto, are believed to have accreted as part of the process by which Jupiter itself formed. The following table summarizes the radius, mass, distance from the planet center, discoverer and the date of discovery of each of the moons of Jupiter:
Saturn
Saturn is the sixth planet from the Sun and is the second largest in the solar system with an equatorial diameter of 119,300 kilometers (74,130 miles). Much of what is known about the planet is due to the Voyager explorations in 1980-81. Saturn is visibly flattened at the poles, a result of the very fast rotation of the planet on its axis. Its day is 10 hours, 39 minutes long, and it takes 29.5 Earth years to revolve about the Sun. The atmosphere is primarily composed of hydrogen with small amounts of helium and methane. Saturn is the only planet less dense than water (about 30 percent less). In the unlikely event that a large enough ocean could be found, Saturn would float in it. Saturn's hazy yellow hue is marked by broad atmospheric banding similar to, but fainter than, that found on Jupiter.
The wind blows at high speeds on Saturn. Near the equator, it reaches velocities of 500 meters a second (1,100 miles an hour). The wind blows mostly in an easterly direction. The strongest winds are found near the equator and velocity falls off uniformly at higher latitudes. At latitudes greater than 35 degrees, winds alternate east and west as latitude increases.
Saturn's ring system makes the planet one of the most beautiful objects in the solar system. The rings are split into a number of different parts, which include the bright A and B rings and a fainter C ring. The ring system has various gaps. The most notable gap is the Cassini [kah-SEE-nee] Division, which separates the A and B rings. Giovanni Cassini discovered this division in 1675. The Encke [EN-kee] Division, which splits the A Ring, is named after Johann Encke, who discovered it in 1837. Space probes have shown that the main rings are really made up of a large number of narrow ringlets. The origin of the rings is obscure. It is thought that the rings may have been formed from larger moons that were shattered by impacts of comets and meteoroids. The ring composition is not known for certain, but the rings do show a significant amount of water. They may be composed of icebergs and/or snowballs from a few centimeters to a few meters in size. Much of the elaborate structure of some of the rings is due to the gravitational effects of nearby satellites. This phenomenon is demonstrated by the relationship between the F-ring and two small moons that shepherd the ring material.
Radial, spoke-like features in the broad B-ring were also found by the Voyagers. The features are believed to be composed of fine, dust-size particles. The spokes were observed to form and dissipate in the time-lapse images taken by the Voyagers. While electrostatic charging may create spokes by levitating dust particles above the ring, the exact cause of the formation of the spokes is not well understood.
Saturn has 30 named satellites and more continue to be discovered.
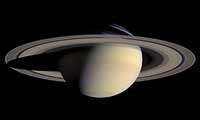 The Greatest Saturn Portrait ...Yet
While cruising around Saturn in early October 2004, Cassini captured a series of images that have been composed into the largest, most detailed, global natural color view of Saturn and its rings ever made.
This grand mosaic consists of 126 images acquired in a tile-like fashion, covering one end of Saturn's rings to the other and the entire planet in between. The images were taken over the course of two hours on Oct. 6, 2004, while Cassini was approximately 6.3 million kilometers (3.9 million miles) from Saturn. Since the view seen by Cassini during this time changed very little, no re-projection or alteration of any of the images was necessary.
Three images (red, green and blue) were taken of each of 42 locations, or "footprints," across the planet. The full color footprints were put together to produce a mosaic that is 8,888 pixels across and 4,544 pixels tall.
The smallest features seen here are 38 kilometers (24 miles) across. Many of Saturn's splendid features noted previously in single frames taken by Cassini are visible in this one detailed, all-encompassing view: subtle color variations across the rings, the thread-like F ring, ring shadows cast against the blue northern hemisphere, the planet's shadow making its way across the rings to the left, and blue-grey storms in Saturn's southern hemisphere to the right. Tiny Mimas and even smaller Janus are both faintly visible at the lower left. The Sun-Saturn-Cassini, or phase, angle at the time was 72 degrees; hence, the partial illumination of Saturn in this portrait. Later in the mission, when the spacecraft's trajectory takes it far from Saturn and also into the direction of the Sun, Cassini will be able to look back and view Saturn and its rings in a more fully-illuminated geometry. (Courtesy NASA/JPL/Space Science Institute)
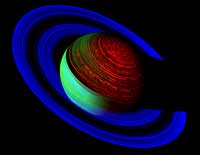 Neon Saturn
Flying over the unlit side of Saturn's rings, the Cassini spacecraft captures Saturn's glow, represented in brilliant shades of electric blue, sapphire and mint green, while the planet's shadow casts a wide net on the rings.
On the night side (right side of image), with no sunlight, Saturn's own thermal radiation lights things up. This light at 5.1 microns wavelength (some seven times the longest wavelength visible to the human eye) is generated deep within Saturn, and works its way upward, eventually escaping into space. Thick clouds deep in the atmosphere block that light. An amazing array of dark streaks, spots, and globe-encircling bands is visible instead. Saturn's strong thermal glow at 5.1 microns even allows these deep clouds to be seen on portions of the dayside (left side), especially where overlying hazes are thin and the glint of the sun off of them is minimal. These deep clouds are likely made of ammonium hydrosulfide and cannot be seen in reflected light on the dayside, since the glint of the sun on overlying hazes and ammonia clouds blocks the view of this level.
A pronounced difference in the brightness between the northern and southern hemispheres is apparent. The northern hemisphere is about twice as bright as the southern hemisphere. This is because high-level, fine particles are about half as prevalent in the northern hemisphere as in the south. These particles block Saturn's glow more strongly, making Saturn look brighter in the north. [ more ] (Courtesy NASA/JPL/University of Arizona)
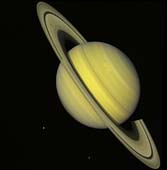 Saturn With Rhea and Dione
NASA's Voyager 2 took this photograph of Saturn on July 21, 1981, when the spacecraft was 33.9 million kilometers (21 million miles) from the planet. Two bright, presumably convective cloud patterns are visible in the mid-northern hemisphere and several dark spoke-like features can be seen in the broad B-ring (left of planet). The moons, Rhea and Dione, appear as blue dots to the south and southeast of Saturn, respectively. Voyager 2 made its closest approach to Saturn on August 25, 1981. (Courtesy NASA/JPL)
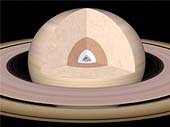 The Interior of Saturn
This picture illustrates the internal structure of Saturn. The outer layer is primarily composed of molecular hydrogen. As we go deeper where the presure reaches 100,000 bars, the gas starts to resemble a hot liquid. When the hydrogen reaches a pressure of 1,000,000 bar, hydrogen changes into a new state of metallic hydrogen. In this state it resembles a molten metal. This metalic hydrogen state occurs at about half of Saturn's radius. Below this is a layer dominated by ice where "ice" denotes a soupy liquid mixture of water, methane, and ammonia under high temperatures and pressures. Finally at the center is a rocky or rocky-ice core. (Copyright 2002 Calvin J. Hamilton)
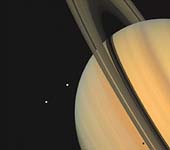 Saturn With Tethys and Dione
Saturn and two of its moons, Tethys (above) and Dione, were photographed by Voyager 1 on November 3, 1980, from a distance of 13 million kilometers (8 million miles). The shadows of Saturn's three bright rings and Tethys are cast onto the cloud tops. The limb of the planet can be seen easily through the 3,500-kilometer-wide (2,170 mile) Cassini Division, which separates ring A from ring B. The view through the much narrower Encke Division, near the outer edge of ring A is less clear. Beyond the Encke Division (at left) is the faintest of Saturn's three bright rings, the C-ring or crepe ring, barely visible against the planet. (Courtesy NASA/JPL)
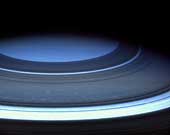 Saturn's Blue Cranium
Saturn's northern hemisphere is presently a serene blue, more befitting of Uranus or Neptune, as seen in this natural color image from Cassini.
Light rays here travel a much longer path through the relatively cloud-free upper atmosphere. Along this path, shorter wavelength blue light rays are scattered effectively by gases in the atmosphere, and it is this scattered light that gives the region its blue appearance. Why the upper atmosphere in the northern hemisphere is so cloud-free is not known, but may be related to colder temperatures brought on by the ring shadows cast there.
Shadows cast by the rings surround the pole, looking almost like dark atmospheric bands. The ring shadows at higher latitudes correspond to locations on the ringplane that are farther from the planet--in other words, the northernmost ring shadow in this view is made by the outer edge of the A ring. (Courtesy NASA/JPL/Space Science Institute)
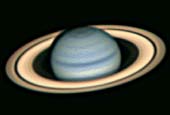 Nordic Optical Telescope
This image of Saturn was taken with the 2.6 meter Nordic Optical Telescope, located at La Palma, Canary Islands. (© Copyright Nordic Optical Telescope Scientific Association -- NOTSA)
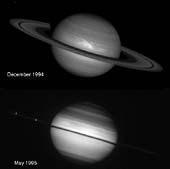 Saturn's Rings Edge-On
In one of nature's most dramatic examples of "now-you see-them, now-you-don't," NASA's Hubble Space Telescope captured Saturn on May 22, 1995, as the planet's magnificent ring system turned edge-on. This ring-plane crossing occurs approximately every 15 years when the Earth passes through Saturn's ring plane.
The rings do not disappear completely because the edge of the rings reflects sunlight. The dark band across the middle of Saturn is the shadow of the rings cast on the planet (the Sun is almost 3 degrees above the ring plane.) The bright stripe directly above the ring shadow is caused by sunlight reflected off the rings onto Saturn's atmosphere. Two of Saturn's icy moons are visible as tiny starlike objects in or near the ring plane.
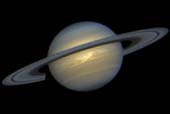 Storm on Saturn
This image, taken by the Hubble Space Telescope, shows a rare storm that appears as a white arrowhead-shaped feature near the planet's equator. The storm is generated by an upwelling of warmer air, similar to a terrestrial thunderhead. The east-west extent of this storm is equal to the diameter of the Earth (about 12,700 kilometers or 7,900 miles). The Hubble images are sharp enough to reveal that Saturn's prevailing winds shape a dark "wedge" that eats into the western (left) side of the bright central cloud. The planet's strongest eastward winds, clocked at 1,600 kilometers (1,000 miles) per hour based on Voyager spacecraft images taken in 1980-81, are at the latitude of the wedge.
To the north of this arrowhead-shaped feature, the winds decrease so that the storm center is moving eastward relative to the local flow. The clouds expanding north of the storm are swept westward by the winds at higher latitudes. The strong winds near the latitude of the dark wedge blow over the northern part of the storm, creating a secondary disturbance that generates the faint white clouds to the east (right) of the storm center. The storm's white clouds are ammonia ice crystals that form when an upward flow of warmer gases shoves its way through Saturn's frigid cloud tops.
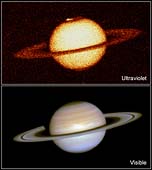 HST Views Aurora on Saturn
The top image shows the first image ever taken of bright aurorae at Saturn's northern and southern poles, as seen in far ultraviolet light by the Hubble Space Telescope. Hubble resolves a luminous, circular band centered on the north pole, where an enormous auroral curtain rises as far as 2,000 kilometers (1,200 miles) above the cloudtops. This curtain changed rapidly in brightness and extent over the two hour period of HST observations.
The aurora is produced as trapped charged particles precipitating from the magnetosphere collide with atmospheric gases. As a result of the bombardment, Saturn's gases glow at far-ultraviolet wavelengths (110-160 nanometers). These wavelengths are absorbed by the Earth's atmosphere, and can only be observed from space-based telescopes.
For comparison, the bottom image is a visible-light color composite of Saturn as seen by Hubble on December 1, 1994. Unlike the ultraviolet image, Saturn's familiar atmospheric belts and zones are clearly seen. The lower cloud deck is not visible at UV wavelengths because sunlight is reflected from higher in the atmosphere.
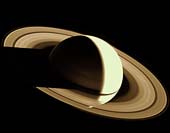 Last View of Saturn
Two days after its encounter with Saturn, Voyager 1 looked back on the planet from a distance of more than 5.0 million kilometers (3.0 million miles). This view of Saturn has never been seen by an earth based telescope, since the earth is so close to the Sun only the sunlit face of Saturn can be seen. (Copyright © 2002 Calvin J. Hamilton)
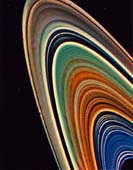 False Color Image of Saturn's Rings
Possible variations in chemical composition from one part of Saturn's ring system to another are visible in this Voyager 2 picture as subtle color variations that can be recorded with special computer-processing techniques. This highly enhanced color view was assembled from clear, orange and ultraviolet frames obtained August 17, 1981 from a distance of 8.9 million kilometers (5.5 million miles). In addition to the previously known blue color of the C-ring and the Cassini Division, the picture shows additional color differences between the inner B-ring and and outer region (where the spokes form) and between these and the A-ring. (Courtesy NASA/JPL)
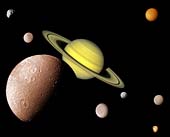 The Saturn System
This picture of the Saturnian system was prepared from an assemblage of images taken by the Voyager 1 spacecraft during its Saturn encounter in November 1980. This view shows Dione in the forefront, Saturn rising behind, Epimetheus (top-left) and Rhea just to the left of Saturn's rings. To the right and below Saturn's rings are Enceladus, Mimas, Tethys, and Iapetus (bottom-right). The cloud covered Titan is at the top-right. (Copyright Calvin J. Hamilton)
Saturn has 31 officially recognized and named satellites. In addition, there are other unconfirmed satellites. One circles in the orbit of Dione, a second is located between the orbits of Tethys and Dione, and a third is located between Dione and Rhea. The unconfirmed satellites were found in Voyager photographs, but were not confirmed by more than one sighting. Recently, the Hubble Space Telescope imaged four objects that might be new moons.
Several generalizations can be made about the satellites of Saturn. Only Titan has an appreciable atmosphere. Most of the satellites have a synchronous rotation. The exceptions are Hyperion, which has a chaotic orbit, and Phoebe. Saturn has a regular system of satellites. That is, the satellites have nearly circular orbits and lie in the equatorial plane. The two exceptions are Iapetus and Phoebe. All of the satellites have a density of < 2 gm/cm3. This indicates they are composed of 30 to 40% rock and 60 to 70% water ice. Most of the satellites reflect 60 to 90% of the light that strikes them. The outer four satellites reflect less than this and Phoebe reflects only 2% of the light that strikes it.
The following table summarizes the radius, mass, distance from the planet center, discoverer and the date of discovery of each of the confirmed satellites of Saturn:
Uranus
Uranus is the seventh planet from the Sun and is the third largest in the solar system. It was discovered by William Herschel in 1781. It has an equatorial diameter of 51,800 kilometers (32,190 miles) and orbits the Sun once every 84.01 Earth years. It has a mean distance from the Sun of 2.87 billion kilometers (1.78 billion miles). It rotates about its axis once every 17 hours 14 minutes. Uranus has at least 22 moons. The two largest moons, Titania and Oberon, were discovered by William Herschel in 1787.
The atmosphere of Uranus is composed of 83% hydrogen, 15% helium, 2% methane and small amounts of acetylene and other hydrocarbons. Methane in the upper atmosphere absorbs red light, giving Uranus its blue-green color. The atmosphere is arranged into clouds running at constant latitudes, similar to the orientation of the more vivid latitudinal bands seen on Jupiter and Saturn. Winds at mid-latitudes on Uranus blow in the direction of the planet's rotation. These winds blow at velocities of 40 to 160 meters per second (90 to 360 miles per hour). Radio science experiments found winds of about 100 meters per second blowing in the opposite direction at the equator.
Uranus is distinguished by the fact that it is tipped on its side. Its unusual position is thought to be the result of a collision with a planet-sized body early in the solar system's history. Voyager 2 found that one of the most striking influences of this sideways position is its effect on the tail of the magnetic field, which is itself tilted 60 degrees from the planet's axis of rotation. The magnetotail was shown to be twisted by the planet's rotation into a long corkscrew shape behind the planet. The magnetic field source is unknown; the electrically conductive, super-pressurized ocean of water and ammonia once thought to lie between the core and the atmosphere now appears to be nonexistent. The magnetic fields of Earth and other planets are believed to arise from electrical currents produced in their molten cores.
There may be a large number of narrow rings, or possibly incomplete rings or ring arcs, as small as 50 meters (160 feet) in width. The individual ring particles were found to be of low reflectivity. At least one ring, the epsilon, was found to be gray in color. The moons Cordelia and Ophelia act as shepherd satellites for the epsilon ring.
 Uranus
The greenish color of it atmosphere is due to methane and This view of Uranus was acquired by Voyager 2 on January 10, 1986. The blue-green appearance of its atmosphere results from methane and high-altitude photochemical smog. This gas absorbs red wavelengths from the incoming sunlight, leaving the predominant bluish color seen here. Towards the bottom of the image a few clouds can be seen. This image is one of the few Voyager pictures that shows this type of cloud. (Copyright Calvin J. Hamilton)
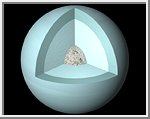 The Interior of Uranus
Our knowledge of the internal structure of Uranus is inferred from the planet's radius, mass, period of rotation, the shape of its gravitational field and the behavior of hydrogen, helium, and water at high pressure. Its internal structure is similar to that of Neptune except for the fact that it is less active in terms of atmospheric dynamics and interior heat flow.
This cut-away view shows Uranus composed of an outer envelope of molecular hydrogen, helium and methane roughly the mass of one to two Earths. Below this region Uranus appears to be composed of a mantle rich in water, methane, ammonia, and other elements. These elements are under high temperatures and pressures deep within the planet. The mantle is equivalent to 10 to 15 earth masses. Uranus's core is composed of rock and ice, and is likely no more than one Earth mass. (Copyright Calvin J. Hamilton)
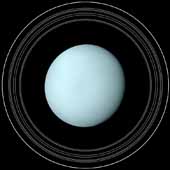 Uranus with its Rings
This is the highest resolution image of Uranus with its rings ever assembled. Four separate images were mosaicked together to create the picture of Uranus. The rings were made from two high resolution images of Uranus's rings in which a strip was cut out and projected for a full 360 degrees. The rings and planet are to scale and shows the view Voyage 2 had of at the time the images were taken. The rings shown in the picture are Epsilon, Delta, Gamma, Eta, Beta, Alpha, 4, 5, and 6. Although there are other rings, these are the ones that could be seen on the Voyger 2 images at the point in time in which the pictures were taken. (Copyright Calvin J. Hamilton)
 Uranus in True and False Color
These two pictures of Uranus, one in true color (left) and the other in false color, were compiled from images returned January 17, 1986, by the narrow-angle camera of Voyager 2. The spacecraft was 9.1 million kilometers (5.7 million miles) from the planet, several days from closest approach. The picture at left has been processed to show Uranus as human eyes would see it from the vantage point of the spacecraft. The picture is a composite of images taken through blue, green and orange filters. The darker shadings at the upper right of the disk correspond to the day-night boundary on the planet. Beyond this boundary lies the hidden northern hemisphere of Uranus, which remains in total darkness as the planet rotates. The blue-green color results from the absorption of red light by methane gas in Uranus' deep, cold and remarkably clear atmosphere. The picture at right uses false color and extreme contrast enhancement to bring out subtle details in the polar region of Uranus. Images obtained through ultraviolet, violet and orange filters were respectively converted to the same blue, green and red colors used to produce the picture at left. The very slight contrasts visible in true color are greatly exaggerated here. In this false-color picture, Uranus reveals a dark polar hood surrounded by a series of progressively lighter concentric bands. One possible explanation is that a brownish haze or smog, concentrated over the pole, is arranged into bands by zonal motions of the upper atmosphere. The bright orange and yellow strip at the lower edge of the planet's limb is an artifact of the image enhancement. In fact, the limb is dark and uniform in color around the planet. (Courtesy NASA/JPL)
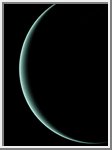 Voyager Farewell Image
This view of Uranus was recorded by Voyager 2 on January 25, l986, as the spacecraft left the planet behind and set forth on its cruise to Neptune. Voyager was 1 million kilometers (620,000 miles) from Uranus when it acquired this wide-angle view. The picture has a resolution of 140 kilometers (90 miles). The thin crescent of Uranus is seen at an angle of 153 degrees between the spacecraft, the planet and the Sun. Even at this extreme angle, Uranus retains the pale blue-green color seen by ground-based astronomers and recorded by Voyager during its historic encounter. This color results from the presence of methane in Uranus' atmosphere; the gas absorbs red wavelengths of light, leaving the predominant hue seen here. The tendency for the crescent to become white at the extreme edge is caused by the presence of a high-altitude haze. (Copyright Calvin J. Hamilton)
 Hubble Tracks Rotation of Uranus
This view of Uranus was acquired by NASA's Hubble Space Telescope and reveals a pair of bright clouds in the planet's southern hemisphere, and a high altitude haze that forms a "cap" above the planet's south pole. This is just one view of a sequence of three that can be obtained by selecting the above gif image.
Hubble's new view was obtained on August 14, 1994, when Uranus was 2.8 billion kilometers (1.7 billion miles) from Earth. These atmospheric details were only previously seen by the Voyager 2 spacecraft, which flew by Uranus in 1986. Since then, detailed observations of Uranus's atmospheric features have not been possible because the planet is at the resolution limit of ground-based telescopes.
Hubble's Wide Field Planetary Camera 2 observed Uranus through a filter that is sensitive to light reflected by a pair of high altitude clouds. This makes a high altitude haze over Uranus' south polar region clearly visible, along with a pair of high altitude clouds or plume-type features that are 4,300 and 3,100 kilometers (2,500 and 1,800 miles) across, respectively. (Credit Kenneth Seidelmann, U.S. Naval Observatory, and NASA)
Two additional Hubble Telescope images can be found here.
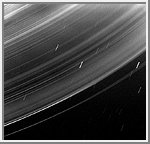 Uranus Ring System
This dramatic Voyager 2 picture reveals a continuous distribution of small particles throughout the Uranian ring system. The unique geometry of this picture makes the previously unseen lanes of fine dust particles visible. All the formerly known rings are visible here; however, some of the brightest features in the image are bright dust lanes not previously seen. The combination of this unique geometry and a long, 96 second exposure allowed this spectacular observation. The image was acquired through the clear filter of Voyager's wide-angle camera. The long exposure produced a noticeable, non-uniform smear as well as streaks due to trailed stars. (Copyright Calvin J. Hamilton)
 Shepherd Satellites
The discovery of two shepherd satellites has advanced our understanding of the structure of the Uranian rings. The moons, Cordelia (1986U7) and Ophelia (1986U8), are seen here on either side of the bright epsilon ring; all 9 of the known Uranian rings are also visible. The epsilon ring appears surrounded by a dark halo as a result of image processing; occasional blips seen on the ring are also artifacts. Lying inward from the epsilon ring are the delta, gamma and eta rings; the beta and alpha rings; and finally the barely visible 4, 5 and 6 rings. The rings have been studied since their discovery in 1977. (Courtesy NASA/JPL)
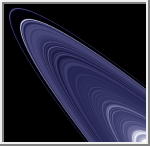 Pseudo-image of Uranus' Ring
This pseudo-image of Uranus' rings was generated by using Voyager 2 frame FDS 26852.19. This image was taken in forward scattered light and shows dust bands not seen in any other image. A 3 pixel wide slice was taken from the most detailed part of the image, averaged to a 1 pixel wide image, then rotated 360 degrees and projected into perspective view. The real color of the rings are neutral gray and they are as dark as charcoal. (Courtesy A. Tayfun Oner)
 Uranus' Rings
The 9 known rings of Uranus are visible here. The somewhat fainter, pastel lines seen between the rings are artifacts of computer enhancement. Six narrow-angle images were used to extract color information from the extremely dark and faint rings. The final image was made from three color averages and represents an enhanced, false-color view. The image shows that the brightest, or epsilon, ring at top is neutral in color, with the fainter 8 remaining rings showing color differences between them. (Courtesy NASA/JPL)
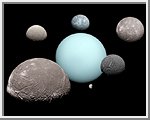 Uranian System
This montage of the Uranian system was prepared from an assemblage of images taken by the Voyager 2 spacecraft during its Uranus encounter in January 1986. This artist's view shows Ariel in the forefront, with Uranus rising behind. Traversing clockwise from Ariel are the satellites Umbriel, Oberon, Titania, Miranda, and the small moon Puck. (Copyright Calvin J. Hamilton)
The following is a summary of the rings of Uranus.
*The distance is measured from the planet center to the start of the ring.
The following table summarizes the radius, mass, distance from the planet center, discoverer and the date of discovery of each of the moons of Uranus:
Neptune
Neptune is the outermost planet of the gas giants. It has an equatorial diameter of 49,500 kilometers (30,760 miles). If Neptune were hollow, it could contain nearly 60 Earths. Neptune orbits the Sun every 165 years. It has eight moons, six of which were found by Voyager. A day on Neptune is 16 hours and 6.7 minutes. Neptune was discovered on September 23, 1846 by Johann Gottfried Galle, of the Berlin Observatory, and Louis d'Arrest, an astronomy student, through mathematical predictions made by Urbain Jean Joseph Le Verrier.
The first two thirds of Neptune is composed of a mixture of molten rock, water, liquid ammonia and methane. The outer third is a mixture of heated gases comprised of hydrogen, helium, water and methane. Methane gives Neptune its blue cloud color.
Neptune is a dynamic planet with several large, dark spots reminiscent of Jupiter's hurricane-like storms. The largest spot, known as the Great Dark Spot, is about the size of the earth and is similar to the Great Red Spot on Jupiter. Voyager revealed a small, irregularly shaped, eastward-moving cloud scooting around Neptune every 16 hours or so. This scooter as it has been dubbed could be a plume rising above a deeper cloud deck.
Long bright clouds, similar to cirrus clouds on Earth, were seen high in Neptune's atmosphere. At low northern latitudes, Voyager captured images of cloud streaks casting their shadows on cloud decks below.
The strongest winds on any planet were measured on Neptune. Most of the winds there blow westward, opposite to the rotation of the planet. Near the Great Dark Spot, winds blow up to 2,000 kilometers (1,200 miles) an hour.
Neptune has a set of four rings which are narrow and very faint. The rings are made up of dust particles thought to have been made by tiny meteorites smashing into Neptune's moons. From ground based telescopes the rings appear to be arcs but from Voyager 2 the arcs turned out to be bright spots or clumps in the ring system. The exact cause of the bright clumps is unknown.
The magnetic field of Neptune, like that of Uranus, is highly tilted at 47 degrees from the rotation axis and offset at least 0.55 radii (about 13,500 kilometers or 8,500 miles) from the physical center. Comparing the magnetic fields of the two planets, scientists think the extreme orientation may be characteristic of flows in the interior of the planet and not the result of that planet's sideways orientation or of any possible field reversals at either planet.
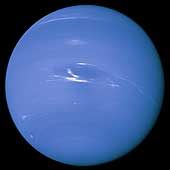 Neptune
This picture of Neptune was taken by Voyager 2 on August 20, 1989. One of the great cloud features, dubbed the Great Dark Spot by Voyager scientists, can be seen toward the center of the image. It is at a latitude of 22 degrees south and circuits Neptune every 18.3 hours. The bright clouds to the south and east of the Great Dark Spot constantly change their appearances in periods as short as four hours. (Copyright Calvin J. Hamilton)
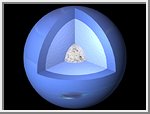 The Interior of Neptune
Our knowledge of the internal structure of Neptune is inferred from the planet's radius, mass, period of rotation, the shape of its gravitational field and the behavior of hydrogen, helium, and water at high pressure. This cut-away view shows Neptune composed of an outer envelope of molecular hydrogen, helium and methane roughly the mass of one to two Earths. Below this region Neptune appears to be composed of a mantle rich in water, methane, ammonia, and other elements. These elements are under high temperatures and pressures deep within the planet. The mantle is equivalent to 10 to 15 earth masses. Neptune's core is composed of rock and ice, and is likely no more than one Earth mass. (Copyright Calvin J. Hamilton)
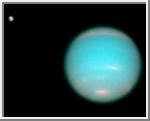 HST Observes Triton and Neptune
This mosaic combines an almost true-color picture of Neptune taken by the Hubble Space Telescope's (HST) Wide Field Planetary Camera (WFPC), with a picture of Triton taken with the HST's Faint Object Camera. Although faint, the image of Triton vaguely shows a brighter equatorial region. The south pole is to the lower left.
The picture of Neptune shows a bright cloud feature at the south pole, near the bottom of the image. Bright cloud bands can be seen at 30S and 60S latitude. The northern hemisphere also includes a bright cloud band centered near 30� N latitude. (Courtesy of Ted Stryk)
 HST Observations of Neptune
These almost true-color pictures of Neptune were constructed from HST/WFPC2 images taken in blue (467-nm), green (588-nm), and red (673-nm) spectral filters. There is a bright cloud feature at the south pole, near the bottom right of the image. Bright cloud bands can be seen at 30S and 60S latitude. The northern hemisphere also includes a bright cloud band centered near 30° N latitude. The second picture was compiled from images taken after the planet had rotated about 180 degrees of longitude (about 9 hours later) to show the opposite hemisphere.
One feature that is conspicuous by its absence is the storm system known as the Great Dark Spot. The second smaller dark spot, DS2, that was seen during the Voyager-2 encounter was also missing. The absence of these dark spots was one of the biggest surprises of this program. These dramatic changes in the large-scale storm systems and planet-encircling clouds bands on Neptune are not yet completely understood, but they emphasize the dynamic nature of this planet's atmosphere, and the need for further monitoring.
 HST Observes High Altitude Clouds
These three images were taken on October 10, October 18 and November 2, 1994, when Neptune was 4.5 billion kilometers from Earth. Building on Voyager's initial discoveries, Hubble has revealed that Neptune has a remarkably dynamic atmosphere that changes over just a few days. The temperature difference between Neptune's strong internal heat source and its frigid cloud tops (-162° Celcius or -260° Fahrenheit) might trigger instabilities in the atmosphere that drive these large-scale weather changes. The pink features are high-altitude methane ice crystal clouds.
 HST Finds New Dark Spot
In June 1994, the Hubble telescope revealed that the Great Dark Spot found by Voyager 2 was missing. This new image taken on November 2, shows that a new spot near the limb of the planet has formed. Like its predecessor, the new spot has high altitude clouds along its edge, caused by gasses that have been pushed to higher altitudes where they cool to form methane ice crystal clouds. The dark spot may be a zone of clear gas that is a window to a cloud deck lower in the atmosphere.
 Cirrus-like Clouds
This image shows bands of sunlit cirrus-like clouds in Neptune's northern hemisphere. These clouds cast shadows on the blue cloud deck 35 miles below. The white streaky clouds are from 48 to 160 kilometers (30 to 100 miles) wide and extend for thousands of miles. (Copyright Calvin J. Hamilton)
 True-color Image
This Voyager 2 image has been processed by computers so that both the clouds' structure in the dark regions near the pole and the bright clouds east of the Great Dark Spot are visible. Small trails of clouds trending east to west and large-scale structure east of the Great Dark Spot all suggest that waves are present in the atmosphere and play a large role in the type of clouds that are visible. (Courtesy NASA/JPL)
 Great Dark Spot
Feathery white clouds fill the boundary between the dark and light blue regions on the Great Dark Spot. The pinwheel shape of both the dark boundary and the white cirrus suggests that the storm system rotates counterclockwise. Periodic small scale patterns in the white cloud, possibly waves, are short lived and do not persist from one Neptunian rotation to the next. (Courtesy NASA/JPL)
 Change In The Great Dark Spot
The bright cirrus-like clouds of Neptune change rapidly, often forming and dissipating over periods of several to tens of hours. In this sequence spanning two rotations of Neptune (about 36 hours) Voyager 2 observed cloud evolution in the region around the Great Dark Spot at an effective resolution of about 100 kilometers (62 miles) per pixel. The surprisingly rapid changes which occur over the 18 hours separating each panel shows that in this region Neptune's weather is perhaps as dynamic and variable as that of the Earth. However, the scale is immense by our standards. The Earth and the Great Dark Spot are of similar size and in Neptune's frigid atmosphere, where temperatures are as low as 55 degrees Kelvin (-360 F), the cirrus clouds are composed of frozen methane rather than Earth's crystals of water ice. (Courtesy NASA/JPL)
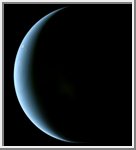 High Resolution Crescent Image of Neptune
This high resolution crescent image of Neptune was taken by the Voyager 2 spacecraft on on August 31, 1989. A circular storm pattern can be seen on the limb of the planet. (Copyright 2001 by Calvin J. Hamilton)
 Parting Look
This Voyager 2 image shows a beautiful dual-crescent view of Neptune and Triton. The image, acquired on August 31, 1989, is a parting tribute of the Voyager mission. (Copyright Calvin J. Hamilton)
 Small Dark Spot
This image shows the Small Dark Spot, which is south of the Great Dark Spot. The small spot is thought to be a storm in Neptune's atmosphere, perhaps similar to Jupiter's Great Red Spot. (Copyright Calvin J. Hamilton)
 Neptune Rings
These two 591-second exposures of the rings of Neptune were taken by Voyager 2 on August 26, 1989 from a distance of 280,000 kilometers (174,000 miles). The two main rings are clearly visible and appear complete over the region imaged. Also visible in this image is the inner faint ring at about 42,000 kilometers (25,000 miles) from the center of Neptune, and the faint band which extends smoothly from the 53,000 kilometer (33,000 miles) ring to roughly halfway between the two bright rings. The bright glare in the center is due to over-exposure of the crescent of Neptune. Numerous bright stars are evident in the background. Both rings are continuous. (Courtesy NASA/JPL)
 Twisted Rings
This portion of one of Neptune's rings appears to be twisted. Scientists believe it looks this way because the original material in the rings was in clumps that formed streaks as the material orbited Neptune. The motion of the spacecraft added to the twisted appearance by causing a slight smearing in the image. (Courtesy NASA/JPL)
The following table is a summary of the rings of Neptune.
*The distance is measured from the planet center to the start of the ring.
The following table summarizes the radius, mass, distance from the planet center, discoverer and the date of discovery of each of the moons of Neptune:
Dwarf Planet Pluto
Although Pluto was discovered in 1930, limited information on the distant object delayed a realistic understanding of its characteristics. Pluto is the second largest known dwarf planet and tenth largest orbiting the Sun. From its time of discovery in 1930 to 2006 it was considered to be the ninth planet in the solar system, but because additional objects have been discovered including Eris which is 27% more massive, the IAU reclassified Pluto and the other objects as dwarf planets. The New Horizons spacecraft was launched on January 16, 2006 and will make its closest approach to Pluto on July 14, 2015. This mission will provide an increased amount of information about this peculiar dwarf planet. The uniqueness of Pluto's orbit, rotational relationship with its satellite, spin axis, and light variations all give it a certain appeal.
Pluto is usually farther from the Sun than any of the eight planets; however, due to the eccentricity of its orbit, it is closer than Neptune for 20 years out of its 249 year orbit. Pluto crossed Neptune's orbit January 21, 1979, made its closest approach September 5, 1989, and remained within the orbit of Neptune until February 11, 1999. This will not occur again until September 2226.
As Pluto approaches perihelion it reaches its maximum distance from the ecliptic due to its 17-degree inclination. Thus, it is far above or below the plane of Neptune's orbit. Under these conditions, Pluto and Neptune will not collide and do not approach closer than 18 A.U. to one another.
Pluto's rotation period is 6.387 days, the same as its satellite Charon. Although it is common for a satellite to travel in a synchronous orbit with its planet, Pluto rotates synchronously with the orbit of its satellite. Thus being tidally locked, Pluto and Charon continuously face each other as they travel through space.
Unlike most planets, but similar to Uranus, Pluto rotates with its poles almost in its orbital plane. Pluto's rotational axis is tipped 122 degrees. When Pluto was first discovered, its relatively bright south polar region was the view seen from the Earth. Pluto appeared to grow dim as our viewpoint gradually shifted from nearly pole-on in 1954 to nearly equator-on in 1973. Pluto's equator is now the view seen from Earth.
During the period from 1985 through 1990, Earth was aligned with the orbit of Charon around Pluto such that an eclipse could be observed every Pluto day. This provided opportunity to collect significant data which led to albedo maps defining surface reflectivity, and to the first accurate determination of the sizes of Pluto and Charon, including all the numbers that could be calculated therefrom.
The first eclipses (mutual events) began blocking the north polar region. Later eclipses blocked the equatorial region, and final eclipses blocked Pluto's south polar region. By carefully measuring the brightness over time, it was possible to determine surface features. It was found that Pluto has a highly reflective south polar cap, a dimmer north polar cap, and both bright and dark features in the equatorial region. Pluto's geometric albedo is 0.49 to 0.66, which is much brighter than Charon. Charon's albedo ranges from 0.36 to 0.39.
The eclipses lasted as much as four hours and by carefully timing their beginning and ending, measurements for their diameters were taken. The diameters can also be measured directly to within about 1 percent by more recent images provided by the Hubble Space Telescope. These images resolve the objects to clearly show two separate disks. The improved optics allow us to measure Pluto's diameter as 2,274 kilometers (1413 miles) and Charon's diameter as 1,172 kilometers (728 miles), just over half the size of Pluto. Their average separation is 19,640 km (12,200 miles). That's roughly eight Pluto diameters.
Average separation and orbital period are used to calculate Pluto and Charon's masses. Pluto's mass is about 6.4 x 10⁻⁹ solar masses. This is close to 7 (was 12 x's) times the mass of Charon and approximately 0.0021 Earth mass, or a fifth of our moon.
Pluto's average density lies between 1.8 and 2.1 grams per cubic centimeter. It is concluded that Pluto is 50% to 75% rock mixed with ices. Charon's density is 1.2 to 1.3 g/cm3, indicating it contains little rock. The differences in density tell us that Pluto and Charon formed independently, although Charon's numbers derived from HST data are still being challenged by ground based observations. Pluto and Charon's origin remains in the realm of theory.
Pluto's icy surface is 98% nitrogen (N2). Methane (CH4) and traces of carbon monoxide (CO) are also present. The solid methane indicates that Pluto is colder than 70 Kelvin. Pluto's temperature varies widely during the course of its orbit since Pluto can be as close to the sun as 30 AU and as far away as 50 AU. There is a thin atmosphere that freezes and falls to the surface as the planet moves away from the Sun. The atmospheric pressure deduced for Pluto's surface is 1/100,000 that of Earth's surface pressure.
Pluto was officially labeled the ninth planet by the International Astronomical Union in 1930 and named for the Roman god of the underworld. It was the first and only planet to be discovered by an American, Clyde W. Tombaugh. It has since been reclassified as a Dwarf Planet along with Eris and Ceres.
The path toward its discovery is credited to Percival Lowell who founded the Lowell Observatory in Flagstaff, Arizona and funded three separate searches for "Planet X." Lowell made numerous unsuccessful calculations to find it, believing it could be detected from the effect it would have on Neptune's orbit. Dr. Vesto Slipher, the observatory director, hired Clyde Tombaugh for the third search and Clyde took sets of photographs of the plane of the solar system (ecliptic) one to two weeks apart and looked for anything that shifted against the backdrop of stars. This systematic approach was successful and Pluto was discovered by this young (born 4 Feb 1906) 24 year old Kansas lab assistant on February 18, 1930. Pluto is actually too small to be the "Planet X" Percival Lowell had hoped to find. Pluto's was a serendipitous discovery.
 Pluto & Charon
This view of Pluto was taken by the Hubble Space Telescope. It shows a rare image of tiny Pluto with its moon Charon, which is slightly smaller than the planet. Because Pluto has not yet been visited by any spacecraft, it remains a mysterious planet. Due to its great distance from the sun, Pluto's surface is believed to reach temperatures as low as -240°C (-400°F). From Pluto's surface, the Sun appears as only a very bright star. (Courtesy NASA)
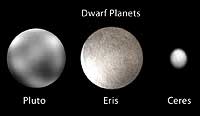 Dwarf Planets
The following images represent the three newly designated dwarf planets. The image of Pluto was rendered from a map created from a servies of Hubble images. Eris is an artistic image, and Ceres is a Hubble telescope image.
(Copyright Calvin J. Hamilton)
 Hubble Telescope Image
This is the clearest view yet of the distant planet Pluto and its moon, Charon, as revealed by the Hubble Space Telescope (HST). The image was taken on February 21, 1994, when the planet was 4.4 billion kilometers (2.7 billion miles) from the Earth.
The HST corrected optics show the two objects as clearly separate and sharp disks. This now allows astronomers to measure directly (to within about 1 percent) Pluto's diameter of 2,320 kilometers (1,440 miles) and Charon's diameter of 1,270 kilometers (790 miles).
The HST observations show that Charon is bluer than Pluto. This means that the worlds have different surface composition and structure. A bright highlight on Pluto indicates that it might have a smoothly reflecting surface layer. A detailed analysis of the HST image also suggests that there is a bright area parallel to the equator of Pluto. However, subsequent observations are needed to confirm that this feature is real. The new HST image was taken when Charon was near its maximum elongation from Pluto (0.9 arcseconds). The two worlds are 19,640 kilometers (12,200 miles) apart. (Courtesy NASA/ESA/ESO)
 The Surface of Pluto
The never-before-seen surface of the distant planet Pluto is resolved in these NASA Hubble Space Telescope pictures. These images, which were made in blue light, show that Pluto is an unusually complex object, with more large-scale contrast than any planet, except Earth. Pluto probably shows even more contrast and perhaps sharper boundaries between light and dark areas than is shown here, but Hubble's resolution (just like early telescopic views of Mars) tends to blur edges and blend together small features sitting inside larger ones.
The two smaller inset pictures at the top are actual images from Hubble. North is up. Each square pixel (picture element) is more than 100 miles across. At this resolution, Hubble discerns roughly 12 major "regions" where the surface is either bright or dark. The larger images (bottom) are from a global map constructed through computer image processing performed on the Hubble data. Opposite hemispheres of Pluto are seen in these two views. (Courtesy NASA/ESA/ESO)
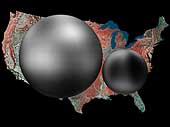 Pluto, Charon, and USA Comparison
This image shows the approximate size of Pluto and Charon by overlaying them on an Advanced Very High Resolution Radiometer (AVHRR) image of the United States of America. Pluto is about 2274 kilometers (1410 miles) in diameter and Charon 1172 kilometers (727 miles) in diameter. The image of Pluto is based upon Hubble observations taken of Pluto in June and July of 1994. The Charon image is based upon photometric measurements acquired by Marc Buie of Lowell Observatory. (Copyright 1998 by Calvin J. Hamilton)
 Map of the Surface of Pluto
This is the first image-based surface map of the solar system's most remote planet, Pluto. The map, which covers 85% of the planet's surface, confirms that Pluto has a dark equatorial belt and bright polar caps, as inferred from ground-based light curves obtained during the mutual eclipses that occurred between Pluto and its satellite Charon in the late 1980s.
The brightness variations in this map may be due to topographic features such as basins and fresh impact craters. However, most of the surface features are likely produced by the complex distribution of frosts that migrate across Pluto's surface with its orbital and seasonal cycles and chemical byproducts deposited out of Pluto's nitrogen-methane atmosphere. Names may later be proposed for some of the larger regions.
Image reconstruction techniques smooth out the coarse pixels in the four raw images to reveal major regions where the surface is either bright or dark. The black strip across the bottom corresponds to the region surrounding Pluto's south pole, which was pointed away from Earth when the observations were made, and could not be imaged. (Courtesy NASA/ESA/ESO)
 Ground vs. Hubble Comparison
This image shows a comparison between a ground based view (left) and a Hubble Space Telescope view (right) of Pluto and Charon.
 Nordic Optical Telescope
This image of Pluto was taken with the 2.6 meter Nordic Optical Telescope, located at La Palma, Canary Islands. It is a good example of the best imagery that can be obtained from Earth-based telescopes. (© Copyright Nordic Optical Telescope Scientific Association -- NOTSA)
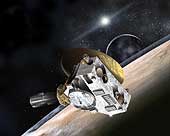 New Horizons: Pluto/Charon Mission
Artist's concept of the New Horizons spacecraft during its planned encounter with Pluto and its moon, Charon. The craft's miniature cameras, radio science experiment, ultraviolet and infrared spectrometers and space plasma experiments would characterize the global geology and geomorphology of Pluto and Charon, map their surface compositions and temperatures, and examine Pluto's atmosphere in detail. The spacecraft's most prominent design feature is a nearly 7-foot (2.1-meter) dish antenna, through which it would communicate with Earth from as far as 4.7 billion miles (7.5 billion kilometers) away. (Courtesy NASA/JHUAPL/SwRI)
Asteroid
Asteroids are rocky and metallic objects that orbit the Sun but are too small to be considered planets. They are known as minor planets. Asteroids range in size from Ceres, which has a diameter of about 1000 km, down to the size of pebbles. Sixteen asteroids have a diameter of 240 km or greater. They have been found inside Earth's orbit to beyond Saturn's orbit. Most, however, are contained within a main belt that exists between the orbits of Mars and Jupiter. Some have orbits that cross Earth's path and some have even hit the Earth in times past. One of the best preserved examples is Barringer Meteor Crater near Winslow, Arizona.
Asteroids are material left over from the formation of the solar system. One theory suggests that they are the remains of a planet that was destroyed in a massive collision long ago. More likely, asteroids are material that never coalesced into a planet. In fact, if the estimated total mass of all asteroids was gathered into a single object, the object would be less than 1,500 kilometers (932 miles) across -- less than half the diameter of our Moon.
Much of our understanding about asteroids comes from examining pieces of space debris that fall to the surface of Earth. Asteroids that are on a collision course with Earth are called meteoroids. When a meteoroid strikes our atmosphere at high velocity, friction causes this chunk of space matter to incinerate in a streak of light known as a meteor. If the meteoroid does not burn up completely, what's left strikes Earth's surface and is called a meteorite.
Of all the meteorites examined, 92.8 percent are composed of silicate (stone), and 5.7 percent are composed of iron and nickel; the rest are a mixture of the three materials. Stony meteorites are the hardest to identify since they look very much like terrestrial rocks.
Because asteroids are material from the very early solar system, scientists are interested in their composition. Spacecraft that have flown through the asteroid belt have found that the belt is really quite empty and that asteroids are separated by very large distances. Before 1991 the only information obtained on asteroids was though Earth based observations. Then on October 1991 asteroid 951 Gaspra was visited by the Galileo spacecraft and became the first asteroid to have hi-resolution images taken of it. Again on August 1993 Galileo made a close encounter with asteroid 243 Ida. This was the second asteroid to be visited by spacecraft. Both Gaspra and Ida are classified as S-type asteroids composed of metal-rich silicates.
On June 27, 1997 the spacecraft NEAR made a high-speed close encounter with asteroid 253 Mathilde. This encounter gave scientists the first close-up look of a carbon rich C-type asteroid. This visit was unique because NEAR was not designed for flyby encounters. NEAR is an orbiter destined for asteroid Eros in January of 1999.
Astronomers have studied a number of asteroids through Earth-based observations. Several notable asteroids are Toutatis, Castalia, Geographos and Vesta. Astronomers studied Toutatis, Geographos and Castalia using Earth-based radar observations during close approaches to the Earth. Vesta was observed by the Hubble Space Telescope.
Comet
Comets are small, fragile, irregularly shaped bodies composed of a mixture of non-volatile grains and frozen gases. They have highly elliptical orbits that bring them very close to the Sun and swing them deeply into space, often beyond the orbit of Pluto.
Comet structures are diverse and very dynamic, but they all develop a surrounding cloud of diffuse material, called a coma, that usually grows in size and brightness as the comet approaches the Sun. Usually a small, bright nucleus (less than 10 km in diameter) is visible in the middle of the coma. The coma and the nucleus together constitute the head of the comet.
As comets approach the Sun they develop enormous tails of luminous material that extend for millions of kilometers from the head, away from the Sun. When far from the Sun, the nucleus is very cold and its material is frozen solid within the nucleus. In this state comets are sometimes referred to as a "dirty iceberg" or "dirty snowball," since over half of their material is ice. When a comet approaches within a few AU of the Sun, the surface of the nucleus begins to warm, and volatiles evaporate. The evaporated molecules boil off and carry small solid particles with them, forming the comet's coma of gas and dust.
When the nucleus is frozen, it can be seen only by reflected sunlight. However, when a coma develops, dust reflects still more sunlight, and gas in the coma absorbs ultraviolet radiation and begins to fluoresce. At about 5 AU from the Sun, fluorescence usually becomes more intense than reflected light.
As the comet absorbs ultraviolet light, chemical processes release hydrogen, which escapes the comet's gravity, and forms a hydrogen envelope. This envelope cannot be seen from Earth because its light is absorbed by our atmosphere, but it has been detected by spacecraft.
The Sun's radiation pressure and solar wind accelerate materials away from the comet's head at differing velocities according to the size and mass of the materials. Thus, relatively massive dust tails are accelerated slowly and tend to be curved. The ion tail is much less massive, and is accelerated so greatly that it appears as a nearly straight line extending away from the comet opposite the Sun. The following view of Comet West shows two distinct tails. The thin blue plasma tail is made up of gases and the broad white tail is made up of microscopic dust particles.

Comet West Each time a comet visits the Sun, it loses some of its volatiles. Eventually, it becomes just another rocky mass in the solar system. For this reason, comets are said to be short-lived, on a cosmological time scale. Many scientists believe that some asteroids are extinct comet nuclei, comets that have lost all of their volatiles.
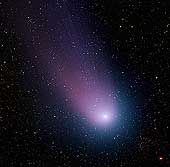 Comet Neat
This image of comet C/2001 Q4 (NEAT) was taken at the WIYN 0.9-meter telescope at Kitt Peak National Observatory near Tucson, Arizona, on May 7, 2004.
The image was captured with the Mosaic I camera, which has a one-square degree field of view, or about five times the size of the Moon. Even with this large field, only the comet's coma and the inner portion of its tail are visible. A small star cluster (C0736-105, or Melotte 72) is visible in the lower right of the image, between the head of the comet and the bright red star in the lower-right corner. (Courtesy NASA, NOAO, NSF, STScI)
 Comet Kohoutek
This color photograph of the comet Kohoutek was taken by members of the lunar and planetary laboratory photographic team from the University of Arizona. They photographed the comet from the Catalina observatory with a 35mm camera on January 11, 1974. (Courtesy NASA)
 Comet Hyakutake
These Hubble Space Telescope images of comet Hyakutake were taken on March 25, 1996 when the comet passed at a distance of 9.3 million miles from Earth. These images focus on a very small region near the heart of the comet, the icy, solid nucleus and provide an exceptionally clear view of the near-nucleus region of the comet.
The left image is 2070 miles across (3340 km) and shows that most of the dust is being produced on the sunward-facing hemisphere of the comet. Also at upper left are three small pieces which have broken off the comet and are forming their own tails. Icy regions on the nucleus are activated as they rotate into sunlight, ejecting large amounts of dust in the jets that are faintly visible in this image. Sunlight striking this dust eventually turns it around and "blows" it into the tailward hemisphere.
The bottom-right image is an expanded view of the near-nucleus region and is only 470 miles (760 km) across. The nucleus is near the center of the frame, but the brightest area is probably the tip of the strongest dust jet rather than the nucleus itself. Presumably, the nucleus surface lies just below this bright jet. The top-right image shows pieces of the nucleus that apparently broke off. The image shows at least three separate objects that are probably made up of coarse-grained dust. Large fragments of the nucleus would not be accelerated into the tail, which appears to be the case in this image. (Credit: H. A. Weaver--Applied Research Corp., HST Comet Hyakutake Observing Team, and NASA)
 First X-Rays From Comet Hyakutake Discovered
This image shows the discovery of a strong X-ray radiation signal coming from comet Hyakutake. The image was made on March 27, 1996 using Germany's orbiting ROSAT satellite. The comet was near its closest approach to the Earth at a distance of less than 10 million miles when X-ray emmisions were first detected by ROSAT. The strength and rapid changes in intensity of the comet's X-ray emission both surprised and puzzled astronomers. "We had no clear expectation that comets shine in X-rays," said Dr. Michael J. Mumma of NASA's Goddard Space Flight Center, Greenbelt, MD. X-rays have never been found from a comet before, and scientists had optimistically predicted an intensity that turned out to be about 100 times weaker than the radiation actually detected by ROSAT. Strong changes in the brightness of the X-rays were another surprise. There were pronounced increases and decreases in the X-ray brightness from one ROSAT observation to another, typically over a time difference of a few hours.
Still another puzzle is the nature of the physical process that generates the X-rays, but the ROSAT image may contain clues to this process. In the image, the X-rays from the comet seem to come from a crescent-shaped region on the sunward side of Comet Hyakutake. One preliminary theory is that X-ray emission from the Sun was absorbed by a cloud of gaseous water molecules surrounding the nucleus of the comet, and then were re-emitted by the molecules in a process physicists call "fluorescence." According to this idea, the cloud is so thick that its sunward side absorbs nearly all the incoming solar X-rays, so that none reach the remainder of the cloud. This could explain why the cometary X-ray emission has the form of a crescent, rather than that of a sphere around the nucleus. A second possible explanation is that the X-rays are produced from the violent collision between the comet material and the supersonic "wind" of plasma and particles streaming away from the Sun.
 Comet 1993a Mueller
This is a CCD image of comet 1993a Mueller, taken on October 6, 1993 with a 288mm f/5.2 Schmidt-Cassegrain telescope. The comet has a coma diameter of 3' and a fan-shaped tail, up to 7' long. (Courtesy Erich Meyer and Herbert Raab, Austria)
Comet West (1975)
This photograph was taken by amateur astronomer John Loborde on March 9, 1976. This picture shows two distinct tails. The thin blue plasma tail is made up of gases and the broad white tail is made up of microscopic dust particles. (Courtesy John Laborde)
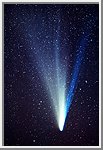 Comet West (1975)
This image of comet West was taken by John Laborde at the Tierra Del Sol Observatory site in San Diego County. The exposure was 30 minutes with a 135 mm Nikon lens. (Courtesy John Laborde)
 Comet Hale-Bopp
These NASA Hubble Space Telescope pictures of comet Hale-Bopp show a remarkable "pinwheel" pattern and a blob of free-flying debris near the nucleus. The bright clump of light along the spiral (above the nucleus, which is near the center of the frame) may be a piece of the comet's icy crust that was ejected into space by a combination of ice evaporation and the comet's rotation, and which then disintegrated into a bright cloud of particles.
Although the "blob" is about 3.5 times fainter than the brightest portion at the nucleus, the lump appears brighter because it covers a larger area. The debris follows a spiral pattern outward because the solid nucleus is rotating like a lawn sprinkler, completing a single rotation about once per week.
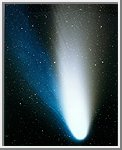 Comet Hale-Bopp
This image of comet Hale-Bopp was taken by John Laborde with his home designed and built, 8.8" f/3.7 Wright Schmidt Camera. The picture was taken at the Tierra Del Sol Observatory site in San Diego County with a 25 minute exposure on Kodak PPF400 film. (Courtesy John Laborde)
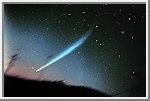 Comet Ikeya-Seki
This image of comet Ikeya-Seki was taken by John Laborde in Poway, California just before dawn. The exposure was 15 minutes with a 55 mm Nikon lens. (Courtesy John Laborde)
Meteoroids and Meteorites
The term meteor comes from the Greek meteoron, meaning phenomenon in the sky. It is used to describe the streak of light produced as matter in the solar system falls into Earth's atmosphere creating temporary incandescence resulting from atmospheric friction. This typically occurs at heights of 80 to 110 kilometers (50 to 68 miles) above Earth's surface. The term is also used loosely with the word meteroid referring to the particle itself without relation to the phenomena it produces when entering the Earth's atmosphere. A meteoroid is matter revolving around the sun or any object in interplanetary space that is too small to be called an asteroid or a comet. Even smaller particles are called micrometeoroids or cosmic dust grains, which includes any interstellar material that should happen to enter our solar system. A meteorite is a meteoroid that reaches the surface of the Earth without being completely vaporized.
One of the primary goals of studying meteorites is to determine the history and origin of their parent bodies. Several achondrites sampled from Antarctica since 1981 have conclusively been shown to have originated from the moon based on compositional matches of lunar rocks obtained by the Apollo missions of 1969-1972. Sources of other specific metorites remain unproven, although another set of eight achondrites are suspected to have come from Mars. These meteorites contain atmospheric gases trapped in shock melted minerals which match the composition of the Martian atmosphere as measured by the Viking landers in 1976. All other groups are presumed to have originated on asteroids or comets; the majority of meteorites are believed to be fragments of asteroids.
Meteorites have proven difficult to classify, but the three broadest groupings are stony, stony iron, and iron. The most common meteorites are chondrites, which are stony meteorites. Radiometric dating of chondrites has placed them at the age of 4.55 billion years, which is the approximate age of the solar system. They are considered pristine samples of early solar system matter, although in many cases their properties have been modified by thermal metamorphism or icy alteration. Some meteoriticists have suggested that the different properties found in various chondrites suggest the location in which they were formed. Enstatite chondrites contain the most refractory elements and are believed to have formed in the inner solar system. Ordinary chondrites, being the most common type containing both volatile and oxidized elements, are thought to have formed in the inner asteroid belt. Carbonaceous chondrites, which have the highest proportions of volatile elements and are the most oxidized, are thought to have originated in even greater solar distances. Each of these classes can be further subdivided into smaller groups with distinct properties.
Other meteorite types which have been geologically processed are achondrites, irons and pallasites. Achondrites are also stony meteorites, but they are considered differentiated or reprocessed matter. They are formed by melting and recrystallization on or within meteorite parent bodies; as a result, achondrites have distinct textures and mineralogies indicative of igneous processes. Pallasites are stony iron meteorites composed of olivine enclosed in metal. Iron meteorites are classified into thirteen major groups and consist primarily of iron-nickel alloys with minor amounts of carbon, sulfur, and phosphorus. These meteorites formed when molten metal segregated from less dense silicate material and cooled, showing another type of melting behavior within meteorite parent bodies. Thus, meteoritescontain evidence of changes that occurred on the parent bodies from which they were removed or broken off, presumably by impacts, to be placed in the first of many revolutions.
The motion of meteoroids can be severely perturbed by the gravitational fields of major planets. Jupiter's gravitational influence is capable of reshaping an asteroid's orbit from the main belt so that it dives into the inner solar system and crosses the orbit of Earth. This is apparently the case of the Apollo and Vesta asteroid fragments.
Particles found in highly correlated orbits are called a stream components and those found in random orbits are called sporadic components. It is thought that most meteor streams are formed by the decay of a comet nucleus and consequently are spread around the original orbit of the comet. When Earth's orbit intersects a meteor stream, the meteor rate is increased and a meteor shower results. A meteor shower typically will be active for several days. A particularly intense meteor shower is called a meteor storm. Sporadic meteors are believed to have had a gradual loss of orbital coherence with a meteor shower due to collisions and radiative effects, further enhanced by gravitational influences. There is still some debate concerning sporadic meteors and their relationship with showers.
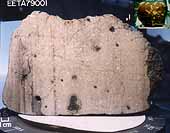 Martian Meteorite
This meteorite, a basalt lava rock nearly indistinguishable from many Earth rocks, provided the first strong proof that meteorites could come from Mars. Originally weighing nearly 8 kilograms (17.6 pounds), it was collected in 1979 in the Elephant Moraine area of Antarctica. The side of the cube at the lower left in this image measures 1 centimeter (0.4 inches).
This picture shows a sawn face of this fine-grained gray rock. (The vertical stripes are saw marks.) The black patches in the rock are melted rock, or glass, formed when a large meteorite hit Mars near the rock. The meteorite impact probably threw this rock, dubbed "EETA79001," off Mars and toward Antarctica on Earth. The black glass contains traces of martian atmosphere gases. This meteorite is 180 million years old.
The Mars Exploration Rover Opportunity has discovered that a rock dubbed "Bounce" at Meridiani Planum has a very similar mineral composition to this meteorite and likely shares common origins. Bounce itself is thought to have originated outside the area surrounding Opportunity's landing site; an impact or collision likely threw the rock away from its primary home.(Courtesy NASA/JSC/JPL)
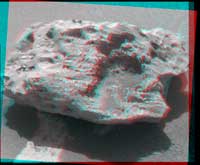 'Block Island' Meteorite on Mars
Composition measurements by NASA's Mars Exploration Rover Opportunity confirm that this rock on the Martian surface is an iron-nickel meteorite.
This image combines exposures from the left eye and right eye of the rover's panoramic camera to provide a three-dimensional view when seen through red-green glasses with the red lens on the left. The camera took the component images during the 1,961st Martian day, or sol, of Opportunity's mission on Mars (July 31), after approaching close enough to touch the rock with tools on the rover's robotic arm.
Researchers have informally named the rock "Block Island." With a width of about two-thirds of a meter (2 feet), it is the largest meteorite yet found on Mars. Opportunity found a smaller iron-nickel meteorite, called "Heat Shield Rock" in late 2004. (Courtesy NASA/JPL-Caltech/Cornell University)
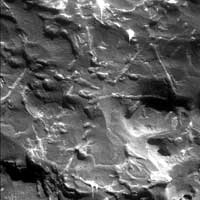 Magnified Look at a Meteorite on Mars
NASA's Mars Exploration Rover Opportunity used its microscopic imager to get this view of the surface of a rock called "Block Island" during the 1,963rd Martian day, or sol, of the rover's mission on Mars (Aug. 1, 2009). The triangular pattern of small ridges seen at the upper right in this image and elsewhere on the rock is characteristic of iron-nickel meteorites found on Earth, especially after they have been cut, polished and etched. Block Island has been identified as an iron-nickel meteorite based on this surface texture and analysis of its composition by Opportunity's alpha particle X-ray spectrometer. At about 60 centimeters (2 feet) across, it is the largest meteorite yet found on Mars.
This image shows a patch 32 millimeters by 32 millimeters (1.3 inches by 1.3 inches) on the surface of Block Island while the target was fully illuminated by the sun. This target on the rock is informally named "New Shoreham." The vertical white streaks, especially near the top and bottom of the image, are artifacts caused by saturation of the camera's CCD (charge-coupled device, or image recorder) where sunlight glinted off metallic facets.
The triangular pattern in the texture of iron-nickel meteorites, called the Widmanstatten pattern, formed more than 4.5 billion years ago as the metal cooled. One iron-nickel mineral, kamacite, formed thin layers along the surface of crystals of another, taenite, which contains less nickel. The two minerals differ in their resistance to either etching by acid or erosion by wind-blown sand, so those processes can make the pattern visible. (Courtesy NASA/JPL-Caltech/Cornell University/USGS)
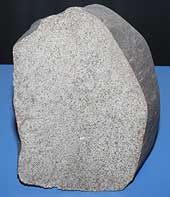 Chondrite Meteorite
This meteorite fell in 1970 in Cherokee County, Oklahoma. It is subclassed as H Group or an olivine-bronzite chondrite. Meteorites are bits of rock that are captured by a planet's gravity and pulled to the surface. This meteorite is of a type named chondrite and is thought to have formed at the same time as the planets in the solar nebula, about 4.55 billion years ago. (Copyright Calvin J. Hamilton)
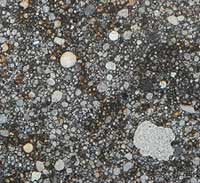 Chondrite Meteorite Slice
This is a section from a stone chondrite meteorite that fell in 1852 in Harghita, Romania. (Copyright Calvin J. Hamilton)
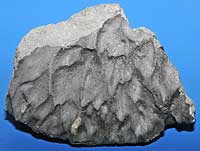 Chondrite Meteorite Showing Regmaglypts
This meteorite fell in 1924. Notice the depreessions on this sample. These are called regmaglypts and are most likely paralled to the air flow direction during the flight of the meteorite. (Copyright Calvin J. Hamilton)
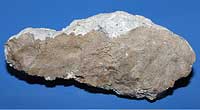 Achondrite Meteorite
Discovered at Norton County, Kansas, this type of meteorite is known as an achondrite. It has a basaltic composition and was probably formed when an asteroid melted about 4.5 billion years ago. The asteroid broke up some time later and this small piece of the asteroid was captured by Earth's gravity and fell to the ground. (Copyright Calvin J. Hamilton)
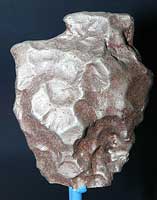 Iron Meteorite
This iron meteorite was found at Victoria Land, Antarctica. This type of meteorite gets its name because it is mostly made of the elements iron and nickel. This sample is probably a small piece from the core of a large asteroid that broke apart. (Copyright Calvin J. Hamilton)
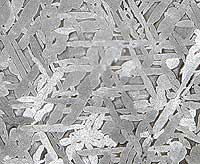 Polished Iron Meteorite
This Iron (III E) Meteorite contains a distinctive crystal pattern known as the Widmanstaten structure. It was fashioned over thousands or millions of years in a low gravity environment at an extremely low rate of cooling producing large crystals of nickel-rich and nickel-poor metallic bands. Such a structure is impossible to forge making the identity of this and similar iron meteorites absolute. Laboratories are only able to imitate it on the microscopic scale. This sample has been cut, polished and etched with acid to enhance the view of the Widmanstaten structure. (Copyright Calvin J. Hamilton)
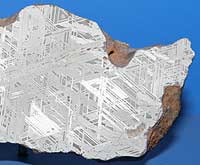 Edmonton - Iron (III CD) Meteorite
This meteorite was found in 1942. (Copyright Calvin J. Hamilton)
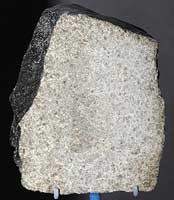 Martian Meteorite
This meteorite fell in 1911 in Alexandria, Egypt. It is believed to have formed on Mars based on its dense pyroxene (greenish-gray) and olivine (brown) crystals which are a signature of martian molten rock. It also contains water-bearing minerals. (Copyright Calvin J. Hamilton)
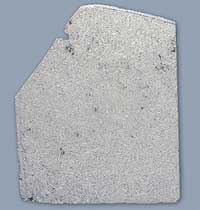 Martian Meteorite Slice
This meteorite fell in 1962 in Katsina Province, Nigeria. It is believed that it is a fragment of a Martian lava flow. It found its way to Earth when a giant impact on Mars catapulted rock fragments into space. A close look at the black glass veins show they are impact melt that contain Martian gases. (Copyright Calvin J. Hamilton)
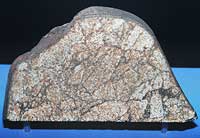 Peekskill Meteorite
This meteorite is famous for the fact that when it fell on October 9, 1992 it destroyed the trunk of a car in Westchester County, New York. (Copyright Calvin J. Hamilton)
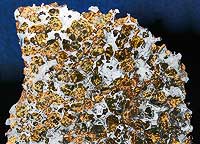 Stony-iron Meteorite
This stoyn-iron, Pallasite meteorite was found in Atacama, Chile in 1822. (Copyright Calvin J. Hamilton)
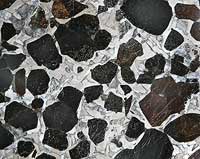 Stony-iron Meteorite
This Stony-iron , pallasite meteorite was found in 1909 in Chihuahua, Mexico. (Copyright Calvin J. Hamilton)
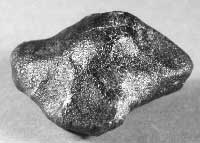 Vesta Meteorite
This meteorite is assumed to be a sample of the crust of the asteroid Vesta, which is only the third solar system object beyond Earth where scientists have a laboratory sample (the other extraterrestrial samples are from Mars and the Moon). The meteorite is unique because it is made almost entirely of the mineral pyroxene, common in lava flows. The meteorite's mineral grain structure also indicates it was once molten, and its oxygen isotopes are unlike oxygen isotopes found for all other rocks of the Earth and Moon. The meteorite's chemical identity points to the asteroid Vesta because it has the same unique spectral signature of the mineral pyroxene.
Most of the identified meteorites from Vesta are in the care of the Western Australian Museum. This 1.4 pound (631 gm) specimen comes from the New England Meteoritical Services. It is a complete specimen measuring 9.6 x 8.1 x 8.7 centimeters (3.7 x 3.1 x 3.4 inches), showing the fusion crust, evidence of the last stage in its journey to Earth. (Photo Credit: R. Kempton, New England Meteoritical Services)
 Introduction |  Sun |  Mercury |  Venus |  Earth |
 Mars |  Jupiter |  Saturn |  Uranus |  Neptune |
 Pluto |  Asteroids |  Comets |  Meteorites |
 Planetary Data |
Our solar system consists of an average star we call the Sun, the planets Mercury, Venus, Earth, Mars, Jupiter, Saturn, Uranus, Neptune, and Pluto. It includes: the satellites of the planets; numerous comets, asteroids, and meteoroids; and the interplanetary medium. The Sun is the richest source of electromagnetic energy (mostly in the form of heat and light) in the solar system. The Sun's nearest known stellar neighbor is a red dwarf star called Proxima Centauri, at a distance of 4.3 light years away. The whole solar system, together with the local stars visible on a clear night, orbits the center of our home galaxy, a spiral disk of 200 billion stars we call the Milky Way. The Milky Way has two small galaxies orbiting it nearby, which are visible from the southern hemisphere. They are called the Large Magellanic Cloud and the Small Magellanic Cloud. The nearest large galaxy is the Andromeda Galaxy. It is a spiral galaxy like the Milky Way but is 4 times as massive and is 2 million light years away. Our galaxy, one of billions of galaxies known, is traveling through intergalactic space.
The planets, most of the satellites of the planets and the asteroids revolve around the Sun in the same direction, in nearly circular orbits. When looking down from above the Sun's north pole, the planets orbit in a counter-clockwise direction. The planets orbit the Sun in or near the same plane, called the ecliptic. Pluto is a special case in that its orbit is the most highly inclined (18 degrees) and the most highly elliptical of all the planets. Because of this, for part of its orbit, Pluto is closer to the Sun than is Neptune. The axis of rotation for most of the planets is nearly perpendicular to the ecliptic. The exceptions are Uranus and Pluto, which are tipped on their sides.
Composition Of The Solar System
The Sun contains 99.85% of all the matter in the Solar System. The planets, which condensed out of the same disk of material that formed the Sun, contain only 0.135% of the mass of the solar system. Jupiter contains more than twice the matter of all the other planets combined. Satellites of the planets, comets, asteroids, meteoroids, and the interplanetary medium constitute the remaining 0.015%. The following table is a list of the mass distribution within our Solar System.- Sun: 99.85%
- Planets: 0.135%
- Comets: 0.01% ?
- Satellites: 0.00005%
- Minor Planets: 0.0000002% ?
- Meteoroids: 0.0000001% ?
- Interplanetary Medium: 0.0000001% ?
Interplanetary Space
Nearly all the solar system by volume appears to be an empty void. Far from being nothingness, this vacuum of "space" comprises the interplanetary medium. It includes various forms of energy and at least two material components: interplanetary dust and interplanetary gas. Interplanetary dust consists of microscopic solid particles. Interplanetary gas is a tenuous flow of gas and charged particles, mostly protons and electrons -- plasma -- which stream from the Sun, called the solar wind. The solar magnetic field extends outward into interplanetary space; it can be measured on Earth and by spacecraft. The solar magnetic field is the dominating magnetic field throughout the interplanetary regions of the solar system, except in the immediate environment of planets which have their own magnetic fields.
 The Terrestrial Planets
The terrestrial planets are the four innermost planets in the solar system, Mercury, Venus, Earth and Mars. They are called terrestrial because they have a compact, rocky surface like the Earth's. The planets, Venus, Earth, and Mars have significant atmospheres while Mercury has almost none. The following diagram shows the approximate distance of the terrestrial planets to the Sun. The Jovian Planets
Jupiter, Saturn, Uranus, and Neptune are known as the Jovian (Jupiter-like) planets, because they are all gigantic compared with Earth, and they have a gaseous nature like Jupiter's. The Jovian planets are also referred to as the gas giants, although some or all of them might have small solid cores. The following diagram shows the approximate distance of the Jovian planets to the Sun. Our Milkyway Galaxy This image of our galaxy, the Milky Way, was taken with NASA's Cosmic Background Explorer's (COBE) Diffuse Infrared Background Experiment (DIRBE). This never-before-seen view shows the Milky Way from an edge-on perspective with the galactic north pole at the top, the south pole at the bottom and the galactic center at the center. The picture combines images obtained at several near-infrared wavelengths. Stars within our galaxy are the dominant source of light at these wavelengths. Even though our solar system is part of the Milky Way, the view looks distant because most of the light comes from the population of stars that are closer to the galactic center than our own Sun. (Courtesy NASA)
Our Milky Way Gets a Makeover Like early explorers mapping the continents of our globe, astronomers are busy charting the spiral structure of our galaxy, the Milky Way. Using infrared images from NASA's Spitzer Space Telescope, scientists have discovered that the Milky Way's elegant spiral structure is dominated by just two arms wrapping off the ends of a central bar of stars. Previously, our galaxy was thought to possess four major arms.
This artist's concept illustrates the new view of the Milky Way, along with other findings presented at the 212th American Astronomical Society meeting in St. Louis, Mo. The galaxy's two major arms (Scutum-Centaurus and Perseus) can be seen attached to the ends of a thick central bar, while the two now-demoted minor arms (Norma and Sagittarius) are less distinct and located between the major arms. The major arms consist of the highest densities of both young and old stars; the minor arms are primarily filled with gas and pockets of star-forming activity.
The artist's concept also includes a new spiral arm, called the "Far-3 kiloparsec arm," discovered via a radio-telescope survey of gas in the Milky Way. This arm is shorter than the two major arms and lies along the bar of the galaxy.
Our sun lies near a small, partial arm called the Orion Arm, or Orion Spur, located between the Sagittarius and Perseus arms. (Courtesy NASA/JPL-Caltech)
Spiral Galaxy, NGC 4414 The majestic galaxy, NGC 4414, is located 60 million light-years away. Like the Milky Way, NGC 4414 is a giant spiral-shaped disk of stars, with a bulbous central hub of older yellow and red stars. The outer spiral arms are considerably bluer due to ongoing formation of young, blue stars, the brightest of which can be seen individually at the high resolution provided by the Hubble camera. The arms are also very rich in clouds of interstellar dust, seen as dark patches and streaks silhouetted against the starlight. (Courtesy NASA/STSCI)
Obliquity of the Eight Planets This illustration shows the obliquity of the eight planets. Obliquity is the angle between a planet's equatorial plane and its orbital plane. By International Astronomical Union (IAU) convention, a planet's north pole lies above the ecliptic plane. By this convention, Venus, Uranus, and Pluto have a retrograde rotation, or a rotation that is in the opposite direction from the other planets. (Copyright 2008 by Calvin J. Hamilton)
The Solar System During the past three decades a myriad of space explorers have escaped the confines of planet Earth and have set out to discover our planetary neighbors. This picture shows the Sun and all nine planets of the solar system as seen by the space explorers. Starting at the top-left corner is the Sun followed by the planets Mercury, Venus, Earth, Mars, Jupiter, Saturn, Uranus, Neptune, and Pluto. (Copyright 1998 by Calvin J. Hamilton)
Sun and Planets This image shows the Sun and nine planets approximately to scale. The order of these bodies are: Sun, Mercury, Venus, Earth, Mars, Jupiter, Saturn, Uranus, Neptune, and Pluto. (Copyright Calvin J. Hamilton)
Jovian Planets This image shows the Jovian planets Jupiter, Saturn, Uranus and Neptune approximately to scale. The Jovian planets are named because of their gigantic Jupiter-like appearance. (Copyright Calvin J. Hamilton)
The Largest Moons and Smallest Planets This image shows the relative sizes of the largest moons and the smallest planets in the solarsystem. The largest satellites pictured in this image are: Ganymede (5262 km), Titan (5150 km), Callisto (4806 km), Io (3642 km), the Moon (3476 km), Europa (3138 km), Triton (2706 km), and Titania (1580 km). Both Ganymede and Titan are larger than planet Mercury followed by Io, the Moon, Europa, and Triton which are larger than the planet Pluto. (Copyright Calvin J. Hamilton)
Diagram of Portrait Frames On February 14, 1990, the cameras of Voyager 1 pointed back toward the Sun and took a series of pictures of the Sun and the planets, making the first ever "portrait" of our solar system as seen from the outside. This image is a diagram of how the frames for the solar system portrait were taken. (Courtesy NASA/JPL)
All Frames from the Family Portrait This image shows the series of pictures of the Sun and the planets taken on February 14, 1990, for the solar system family portrait as seen from the outside. In the course of taking this mosaic consisting of a total of 60 frames, Voyager 1 made several images of the inner solar system from a distance of approximately 6.4 billion kilometers (4 billion miles) and about 32° above the ecliptic plane. Thirty-nine wide angle frames link together six of the planets of our solar system in this mosaic. Outermost Neptune is 30 times further from the Sun than Earth. Our Sun is seen as the bright object in the center of the circle of frames. The insets show the planets magnified many times. (Courtesy NASA/JPL)
Portrait of the Solar System These six narrow-angle color images were made from the first ever "portrait" of the solar system taken by Voyager 1, which was more than 6.4 billion kilometers (4 billion miles) from Earth and about 32° above the ecliptic. Mercury is too close to the Sun to be seen. Mars was not detectable by the Voyager cameras due to scattered sunlight in the optics, and Pluto was not included in the mosaic because of its small size and distance from the Sun. These blown-up images, left to right and top to bottom are Venus, Earth, Jupiter, Saturn, Uranus, and Neptune. (Courtesy NASA/JPL)
The following table lists statistical information for the Sun and planets:
| Distance (AU) | Radius (Earth's) | Mass (Earth's) | Rotation (Earth's) | # Moons | Orbital Inclination | Orbital Eccentricity | Obliquity | Density (g/cm3) | |
| Sun | 0 | 109 | 332,800 | 25-36* | 9 | --- | --- | --- | 1.410 |
|---|---|---|---|---|---|---|---|---|---|
| Mercury | 0.39 | 0.38 | 0.05 | 58.8 | 0 | 7 | 0.2056 | 0.1° | 5.43 |
| Venus | 0.72 | 0.95 | 0.89 | 244 | 0 | 3.394 | 0.0068 | 177.4° | 5.25 |
| Earth | 1.0 | 1.00 | 1.00 | 1.00 | 1 | 0.000 | 0.0167 | 23.45° | 5.52 |
| Mars | 1.5 | 0.53 | 0.11 | 1.029 | 2 | 1.850 | 0.0934 | 25.19° | 3.95 |
| Jupiter | 5.2 | 11 | 318 | 0.411 | 16 | 1.308 | 0.0483 | 3.12° | 1.33 |
| Saturn | 9.5 | 9 | 95 | 0.428 | 18 | 2.488 | 0.0560 | 26.73° | 0.69 |
| Uranus | 19.2 | 4 | 17 | 0.748 | 15 | 0.774 | 0.0461 | 97.86° | 1.29 |
| Neptune | 30.1 | 4 | 17 | 0.802 | 8 | 1.774 | 0.0097 | 29.56° | 1.64 |
| Pluto | 39.5 | 0.18 | 0.002 | 0.267 | 1 | 17.15 | 0.2482 | 119.6° | 2.03 |
Sun
The Sun is the most prominent feature in our solar system. It is the largest object and contains approximately 98% of the total solar system mass. One hundred and nine Earths would be required to fit across the Sun's disk, and its interior could hold over 1.3 million Earths. The Sun's outer visible layer is called the photosphere and has a temperature of 6,000°C (11,000°F). This layer has a mottled appearance due to the turbulent eruptions of energy at the surface.
Solar energy is created deep within the core of the Sun. It is here that the temperature (15,000,000° C; 27,000,000° F) and pressure (340 billion times Earth's air pressure at sea level) is so intense that nuclear reactions take place. This reaction causes four protons or hydrogen nuclei to fuse together to form one alpha particle or helium nucleus. The alpha particle is about .7 percent less massive than the four protons. The difference in mass is expelled as energy and is carried to the surface of the Sun, through a process known as convection, where it is released as light and heat. Energy generated in the Sun's core takes a million years to reach its surface. Every second 700 million tons of hydrogen are converted into helium ashes. In the process 5 million tons of pure energy is released; therefore, as time goes on the Sun is becoming lighter.
The chromosphere is above the photosphere. Solar energy passes through this region on its way out from the center of the Sun. Faculae and flares arise in the chromosphere. Faculae are bright luminous hydrogen clouds which form above regions where sunspots are about to form. Flares are bright filaments of hot gas emerging from sunspot regions. Sunspots are dark depressions on the photosphere with a typical temperature of 4,000°C (7,000°F).
The corona is the outer part of the Sun's atmosphere. It is in this region that prominences appears. Prominences are immense clouds of glowing gas that erupt from the upper chromosphere. The outer region of the corona stretches far into space and consists of particles traveling slowly away from the Sun. The corona can only be seen during total solar eclipses.
The Sun appears to have been active for 4.6 billion years and has enough fuel to go on for another five billion years or so. At the end of its life, the Sun will start to fuse helium into heavier elements and begin to swell up, ultimately growing so large that it will swallow the Earth. After a billion years as a red giant, it will suddenly collapse into a white dwarf -- the final end product of a star like ours. It may take a trillion years to cool off completely.
| Sun Statistics | |
|---|---|
| Mass (kg) | 1.989e+30 |
| Mass (Earth = 1) | 332,830 |
| Equatorial radius (km) | 695,000 |
| Equatorial radius (Earth = 1) | 108.97 |
| Mean density (gm/cm^3) | 1.410 |
| Rotational period (days) | 25-36* |
| Escape velocity (km/sec) | 618.02 |
| Luminosity (ergs/sec) | 3.827e33 |
| Magnitude (Vo) | -26.8 |
| Mean surface temperature | 6,000°C |
| Age (billion years) | 4.5 |
| Principal chemistry Hydrogen Helium Oxygen Carbon Nitrogen Neon Iron Silicon Magnesium Sulfur All others | 92.1% 7.8% 0.061% 0.030% 0.0084% 0.0076% 0.0037% 0.0031% 0.0024% 0.0015% 0.0015% |
Mercury
Mercury was named by the Romans after the fleet-footed messenger of the gods because it seemed to move more quickly than any other planet. It is the closest planet to the Sun, and second smallest planet in the solar system. Its diameter is 40% smaller than Earth and 40% larger than the Moon. It is even smaller than Jupiter's moon Ganymede and Saturn's moon Titan.
If an explorer were to step onto the surface of Mercury, he would discover a world resembling lunar terrain. Mercury's rolling, dust-covered hills have been eroded from the constant bombardment of meteorites. Fault-cliffs rise for several kilometers in height and extend for hundreds of kilometers. Craters dot the surface. The explorer would notice that the Sun appears two and a half times larger than on Earth; however, the sky is always black because Mercury has virtually no atmosphere to cause scattering of light. As the explorer gazes out into space, he might see two bright stars. One appearing as cream colored Venus and the other as blue colored Earth.
Until Mariner 10, little was known about Mercury because of the difficulty in observing it from Earth telescopes. At maximum elongation it is only 28 degrees from the Sun as seen from Earth. Because of this, it can only be viewed during daylight hours or just prior to sunrise or after sunset. When observed at dawn or dusk, Mercury is so low on the horizon that the light must pass through 10 times the amount of Earth's atmosphere than it would if Mercury was directly overhead.
During the 1880's, Giovanni Schiaparelli drew a sketch showing faint features on Mercury. He determined that Mercury must be tidally locked to the Sun, just as the Moon is tidally locked to Earth. In 1962, radio astronomers looked at radio emissions from Mercury and determined that the dark side was too warm to be tidally locked. It was expected to be much colder if it always faced away from the Sun. In 1965, Pettengill and Dyce determined Mercury's period of rotation to be 59 +- 5 days based upon radar observations. Later in 1971, Goldstein refined the rotation period to be 58.65 +- 0.25 days using radar observations. After close observation by the Mariner 10 spacecraft, the period was determined to be 58.646 +- 0.005 days.
Although Mercury is not tidally locked to the Sun, its rotational period is tidally coupled to its orbital period. Mercury rotates one and a half times during each orbit. Because of this 3:2 resonance, a day on Mercury (sun rise to sun rise) is 176 Earth days long as shown by the following diagram.
 |
|---|
Most of the scientific findings about Mercury comes from the Mariner 10 spacecraft which was launched on November 3, 1973. It flew past the planet on March 29, 1974 at a distance of 705 kilometers from the surface. On September 21, 1974 it flew past Mercury for the second time and on March 16, 1975 for the third time. During these visits, over 2,700 pictures were taken, covering 45% of Mercury's surface. Up until this time, scientists did not suspect that Mercury would have a magnetic field. They thought that because Mercury is small, its core would have solidified long ago. The presence of a magnetic field indicates that a planet has an iron core that is at least partially molten. Magnetic fields are generated from the rotation of a conductive molten core and is known as the dynamo effect.
Mariner 10 showed that Mercury has a magnetic field that is 1% as strong as Earth's. This magnet field is inclined 7 degrees to Mercury's axis of rotation and produces a magnetosphere around the planet. The source of the magnetic field is unknown. It might be produced from a partially molten iron core in the planet's interior. Another source of the field might be from remnant magnetization of iron-bearing rocks which were magnetized when the planet had a strong magnetic field during its younger years. As the planet cooled and solidified remnant magnetization was retained.
Even before Mariner 10, Mercury was known to have a high density. Its density is 5.44 g/cm3 which is comparable to Earth's 5.52g/cm3 density. In an uncompressed state, Mercury's density is 5.5 g/cm3 where Earth's is only 4.0 g/cm3. This high density indicates that the planet is 60 to 70 percent by weight metal, and 30 percent by weight silicate. This gives a core radius of 75% of the planet radius and a core volume of 42% of the planet's volume.
Surface of Mercury
The pictures returned from the Mariner 10 spacecraft showed a world that resembles the moon. It is pocked with craters, contains hugh multi-ring basins, and many lava flows. The craters range in size from 100 meters (the smallest resolvable feature on Mariner 10 images) to 1,300 kilometers. They are in various stages of preservation. Some are young with sharp rims and bright rays extending from them. Others are highly degraded, with rims that have been smoothed from the bombardment of meteorites. The largest crater on Mercury is the Caloris basin. A basin was defined by Hartmann and Kuiper (1962) as a "large circular depression with distinctive concentric rings and radial lineaments." Others consider any crater larger than 200 kilometers a basin. The Caloris basin is 1,300 kilometers in diameter, and was probably caused by a projectile larger than 100 kilometers in size. The impact produced concentric mountain rings three kilometers high and sent ejecta 600 to 800 kilometers across the planet. (Another good example of a basin showing concentric rings is the Valhalla region on Jupiter's moon Callisto.) The seismic waves produced from the Caloris impact focused onto the other side of the planet and produced a region of chaotic terrain. After the impact the crater was partially filled with lava flows. Mercury is marked with great curved cliffs or lobate scarps that were apparently formed as Mercury cooled and shrank a few kilometers in size. This shrinking produced a wrinkled crust with scarps kilometers high and hundreds of kilometers long.The majority of Mercury's surface is covered by plains. Much of it is old and heavily cratered, but some of the plains are less heavily cratered. Scientists have classified these plains as intercrater plains and smooth plains. Intercrater plains are less saturated with craters and the craters are less than 15 kilometers in diameter. These plains were probably formed as lava flows buried the older terrain. The smooth plains are younger still with fewer craters. Smooth plains can be found around the Caloris basin. In some areas patches of smooth lava can be seen filling craters.
Mercury's history of formation is similar to that of Earth's. About 4.5 billion years ago the planets formed. This was a time of intense bombardment for the planets as they scooped up matter and debris left around from the nebula that formed them. Early during this formation, Mercury probably differentiated into a dense metallic core, and a silicate crust. After the intense bombardment period, lava flowed across the surface and covered the older crust. By this time much of the debris had been swept up and Mercury entered a lighter bombardment period. During this period the intercrater plains formed. Then Mercury cooled. Its core contracted which in turn broke the crust and produced the prominent lobate scarps. During the third stage, lava flooded the lowlands and produced the smooth plains. During the fourth stage micrometeorite bombardment created a dusty surface also known as regolith. A few larger meteorites impacted the surface and left bright rayed craters. Other than the occasional collisions of a meteorites, Mercury's surface is no longer active and remains the same as it has for millions of years.
Could water exist on Mercury?
It would appear that Mercury could not support water in any form. It has very little atmosphere and is blazing hot during the day, but in 1991 scientists at Caltech bounced radio waves off Mercury and found an unusual bright return from the north pole. The apparent brightening at the north pole could be explained by ice on or just under the surface. But is it possible for Mercury to have ice? Because Mercury's rotation is almost perpendicular to its orbital plain, the north pole always sees the sun just above the horizon. The insides of craters would never be exposed to the Sun and scientists suspect that they would remain colder than -161 C. These freezing temperatures could trap water outgassed from the planet, or ices brought to the planet from cometary impacts. These ice deposits might be covered with a layer of dust and would still show bright radar returns.| Mercury Statistics | |
|---|---|
| Mass (kg) | 3.303e+23 |
| Mass (Earth = 1) | 5.5271e-02 |
| Equatorial radius (km) | 2,439.7 |
| Equatorial radius (Earth = 1) | 3.8252e-01 |
| Mean density (gm/cm^3) | 5.42 |
| Mean distance from the Sun (km) | 57,910,000 |
| Mean distance from the Sun (Earth = 1) | 0.3871 |
| Rotational period (days) | 58.6462 |
| Orbital period (days) | 87.969 |
| Mean orbital velocity (km/sec) | 47.88 |
| Orbital eccentricity | 0.2056 |
| Tilt of axis (degrees) | 0.00 |
| Orbital inclination (degrees) | 7.004 |
| Equatorial surface gravity (m/sec^2) | 2.78 |
| Equatorial escape velocity (km/sec) | 4.25 |
| Visual geometric albedo | 0.10 |
| Magnitude (Vo) | -1.9 |
| Mean surface temperature | 179°C |
| Maximum surface temperature | 427°C |
| Minimum surface temperature | -173°C |
| Atmospheric composition Helium Sodium Oxygen Other | 42% 42% 15% 1% |
- MESSENGER Flies through Mercury's Magnetosphere.
- The Early Formation of Mercury.
- The Final Stages in Mercury's Formation.
For more MESSENGER images of Mercury look at the Mercury Photo/Animation Gallery.
Mercury Shows Its True Colors MESSENGER's Wide Angle Camera (WAC), part of the Mercury Dual Imaging System (MDIS), is equipped with 11 narrow-band color filters. As the spacecraft receded from Mercury after making its closest approach on January 14, 2008, the WAC recorded a 3x3 mosaic covering part of the planet not previously seen by spacecraft. The color image shown here was generated by combining the mosaics taken through the WAC filters that transmit light at wavelengths of 1000 nanometers (infrared), 700 nanometers (far red), and 430 nanometers (violet). These three images were placed in the red, green, and blue channels, respectively, to create the visualization presented here. The human eye is sensitive only across the wavelength range from about 400 to 700 nanometers. Creating a false-color image in this way accentuates color differences on Mercury's surface that cannot be seen in black-and-white (single-color) images.
Color differences on Mercury are subtle, but they reveal important information about the nature of the planet's surface material. A number of bright spots with a bluish tinge are visible in this image. These are relatively recent impact craters. Some of the bright craters have bright streaks (called "rays" by planetary scientists) emanating from them. Bright features such as these are caused by the presence of freshly crushed rock material that was excavated and deposited during the highly energetic collision of a meteoroid with Mercury to form an impact crater. The large circular light-colored area in the upper right of the image is the interior of the Caloris basin. Mariner 10 viewed only the eastern (right) portion of this enormous impact basin, under lighting conditions that emphasized shadows and elevation differences rather than brightness and color differences. MESSENGER has revealed that Caloris is filled with smooth plains that are brighter than the surrounding terrain, hinting at a compositional contrast between these geologic units. The interior of Caloris also harbors several unusual dark-rimmed craters, which are visible in this image. The MESSENGER science team is working with the 11-color images in order to gain a better understanding of what minerals are present in these rocks of Mercury's crust. (Courtesy NASA/JHUAPL)
The Interior of Mercury Most of what is known about the internal structure of Mercury comes from data acquired by the Mariner 10 spacecraft that flew past the planet in 1973 and 1974. Mercury is about a third of the size of Earth, yet its density is comparable to that of Earth. This indicates that Mercury has a large core roughly the size of Earth's moon or about 75% of the planet's radius. The core is likely composed of 60 to 70% iron by mass. Mariner 10's measurements of the planet reveals a dipolar magnetic field possibly produced by a partially molten core. A solid rocky mantle surrounds the core with a thin crust of about 100 kilometers. (Copyright Calvin J. Hamilton)
Caloris Basin—in Color! This false-color image of Mercury, recently published in Science magazine, shows the great Caloris impact basin, visible in this image as a large, circular, orange feature in the center of the picture. The contrast between the colors of the Caloris basin floor and those of the surrounding plains indicate that the composition of Mercury's surface is variable. Many additional geological features with intriguing color signatures can be identified in this image. For example, the bright orange spots just inside the rim of Caloris basin are thought to mark the location of volcanic features, such as the volcano shown in image PIA10942. MESSENGER Science Team members are studying these regional color variations in detail, to determine the different mineral compositions of Mercury's surface and to understand the geologic processes that have acted on it. Images taken through the 11 different WAC color filters were used to create this false-color image. The 11 different color images were compared and contrasted using statistical methods to isolate and enhance subtle color differences on Mercury's surface. (Courtesy NASA/Johns Hopkins University Applied Physics Laboratory/Arizona State)
MESSENGER Discovers Volcanoes on Mercury As reported in the July 4, 2008 issue of Science magazine, volcanoes have been discovered on Mercury's surface from images acquired during MESSENGER's first Mercury flyby. This image shows the largest feature identified as a volcano in the upper center of the scene. The volcano has a central kidney-shaped depression, which is the vent, and a broad smooth dome surrounding the vent. The volcano is located just inside the rim of the Caloris impact basin. The rim of the basin is marked with hills and mountains, as visible in this image. The role of volcanism in Mercury's history had been previously debated, but MESSENGER's discovery of the first identified volcanoes on Mercury's surface shows that volcanism was active in the distant past on the innermost planet. (Courtesy NASA/Johns Hopkins University Applied Physics Laboratory/Carnegie Institution of Washington)
Mercury - in Color! One week ago, the MESSENGER spacecraft transmitted to Earth the first high-resolution image of Mercury by a spacecraft in over 30 years, since the three Mercury flybys of Mariner 10 in 1974 and 1975. MESSENGER's Wide Angle Camera (WAC), part of the Mercury Dual Imaging System (MDIS), is equipped with 11 narrow-band color filters, in contrast to the two visible-light filters and one ultraviolet filter that were on Mariner 10's vidicon camera. By combining images taken through different filters in the visible and infrared, the MESSENGER data allow Mercury to be seen in a variety of high-resolution color views not previously possible. MESSENGER's eyes can see far beyond the color range of the human eye, and the colors seen in the accompanying image are somewhat different from what a human would see.
The color image was generated by combining three separate images taken through WAC filters sensitive to light in different wavelengths; filters that transmit light with wavelengths of 1000, 700, and 430 nanometers (infrared, far red, and violet, respectively) were placed in the red, green, and blue channels, respectively, to create this image. The human eye is sensitive across only the wavelength range 400 to 700 nanometers. Creating a false-color image in this way accentuates color differences on Mercury's surface that cannot be seen in the single-filter, black-and-white image released last week.
This visible-infrared image shows an incoming view of Mercury, about 80 minutes before MESSENGER's closest pass of the planet on January 14, 2008, from a distance of about 27,000 kilometers (17,000 miles). (Courtesy NASA/JHUAPL)
Mercury's Complex Cratering History On January 14, 2008, the MESSENGER spacecraft observed about half of the hemisphere not seen by Mariner 10. These images, mosaicked together by the MESSENGER team, were taken by the Narrow Angle Camera (NAC), part of the Mercury Dual Imaging System (MDIS) instrument, about 20 minutes after MESSENGER's closest approach to Mercury (2:04 pm EST), when the spacecraft was at a distance of about 5,000 kilometers (about 3,100 miles). The image shows features as small as 400 meters (0.25 miles) in size and is about 370 kilometers (230 miles) across.
The image shows part of a large, fresh crater with secondary crater chains located near Mercury's equator on the side of the planet newly imaged by MESSENGER. Large, flat-floored craters often have terraced rims from post-impact collapse of their newly formed walls. The hundreds of secondary impactors that are excavated from the planet's surface by the incoming object create long, linear crater chains radial to the main crater. These chains, in addition to the rest of the ejecta blanket, create the complicated, hilly terrain surrounding the primary crater. By counting craters on the ejecta blanket that have formed since the impact event, the age of the crater can be estimated. This count can then be compared with a similar count for the crater floor to determine whether any material has partially filled the crater since its formation. With their large size and production of abundant secondary craters, these flat-floored craters both illuminate and confound the study of the geological history of Mercury. (Courtesy NASA/JHUAPL)
Looking Toward the South Pole of Mercury On January 14, 2008, the MESSENGER spacecraft passed 200 kilometers (124 miles) above the surface of Mercury and snapped the first pictures of a side of Mercury not previously seen by spacecraft. This image shows that previously unseen side, with a view looking toward Mercury's south pole. The southern limb of the planet can be seen in the bottom right of the image. The bottom left of the image shows the transition from the sunlit, day side of Mercury to the dark, night side of the planet, a transition line known as the terminator. In the region near the terminator, the sun shines on the surface at a low angle, causing the rims of craters and other elevated surface features to cast long shadows, accentuating height differences in the image.
This image was acquired about 98 minutes after MESSENGER's closest approach to Mercury, when the spacecraft was at a distance of about 33,000 kilometers (21,000 miles). (Courtesy NASA/JHUAPL)
MESSENGER Looks to the North As MESSENGER sped by Mercury on January 14, 2008, the Narrow Angle Camera (NAC) of the Mercury Dual Imaging System (MDIS) captured this shot looking toward Mercury's north pole. The surface shown in this image is from the side of Mercury not previously seen by spacecraft. The top right of this image shows the limb of the planet, which transitions into the terminator (the line between the sunlit, day side and the dark, night side) on the top left of the image. Near the terminator, the Sun illuminates surface features at a low angle, casting long shadows and causing height differences of the surface to appear more prominent in this region.
It is interesting to compare MESSENGER's view to the north with the image looking toward the south pole, released on January 21. Comparing these two images, it can be seen that the terrain near the south pole is more heavily cratered while some of the region near the north pole shows less cratered, smooth plains material, consistent with the general observations of the poles made by Mariner 10. MESSENGER acquired over 1200 images of Mercury's surface during its flyby, and the MESSENGER team is busy examining all of those images in detail, to understand the geologic history of the planet as a whole, from pole to pole. (Courtesy NASA/JHUAPL)
Mariner 10 Outgoing Color Image of Mercury This mosaic of Mercury was created from more than 140 images taken by the Mariner 10 spacecraft as it flew past the innermost planet on March 29, 1974. Mariner 10's trajectory brought the spacecraft across the dark hemisphere of Mercury. The images were acquired after the spacecraft exited Mercury's shadow. The color data is from more distant global views. (Copyright Ted Stryk)
MESSENGER Views Mercury's Horizon As the MESSENGER spacecraft drew closer to Mercury for its historic first flyby, the spacecraft's Narrow Angle Camera (NAC) on the Mercury Dual Imaging System (MDIS) acquired an image mosaic of the sunlit portion of the planet. This image is one of those mosaic frames and was acquired on January 14, 2008, 18:10 UTC, when the spacecraft was about 18,000 kilometers (11,000 miles) from the surface of Mercury, about 55 minutes before MESSENGER's closest approach to the planet.
The image shows a variety of surface textures, including smooth plains at the center of the image, many impact craters (some with central peaks), and rough material that appears to have been ejected from the large crater to the lower right. This large 200-kilometer-wide (about 120 miles) crater was seen in less detail by Mariner 10 more than three decades ago and was named Sholem Aleichem for the Yiddish writer. In this MESSENGER image, it can be seen that the plains deposits filling the crater's interior have been deformed by linear ridges. The shadowed area on the right of the image is the day-night boundary, known as the terminator. Altogether, MESSENGER acquired over 1200 images of Mercury, which the science team members are now examining in detail to learn about the history and evolution of the innermost planet. (Courtesy NASA/JHUAPL)
"The Spider" - Radial Troughs within Caloris The Narrow Angle Camera of the Mercury Dual Imaging System (MDIS) on the MESSENGER spacecraft obtained high-resolution images of the floor of the Caloris basin on January 14, 2008. Near the center of the basin, an area unseen by Mariner 10, this remarkable feature - nicknamed "the spider" by the science team - was revealed. A set of troughs radiates outward in a geometry unlike anything seen by Mariner 10. The radial troughs are interpreted to be the result of extension (breaking apart) of the floor materials that filled the Caloris basin after its formation. Other troughs near the center form a polygonal pattern. This type of polygonal pattern of troughs is also seen along the interior margin of the Caloris basin. An impact crater about 40 km (~25 miles) in diameter appears to be centered on "the spider." The straight-line segments of the crater walls may have been influenced by preexisting extensional troughs, but some of the troughs may have formed at the time that the crater was excavated. (Courtesy NASA/JHUAPL)
MESSENGER Reveals Mercury's Geological History Shortly following MESSENGER's closest approach to Mercury on January 14, 2008, the spacecraft's Narrow Angle Camera (NAC) on the Mercury Dual Imaging System (MDIS) instrument acquired this image as part of a mosaic that covers much of the sunlit portion of the hemisphere not viewed by Mariner 10. Images such as this one can be read in terms of a sequence of geological events and provide insight into the relative timing of processes that have acted on Mercury's surface in the past.
The double-ringed crater pictured in the lower left of this image appears to be filled with smooth plains material, perhaps volcanic in nature. This crater was subsequently disrupted by the formation of a prominent scarp (cliff), the surface expression of a major crustal fault system, that runs alongside part of its northern rim and may have led to the uplift seen across a portion of the crater's floor. A smaller crater in the lower right of the image has also been cut by the scarp, showing that the fault beneath the scarp was active after both of these craters had formed. The MESSENGER team is working to combine inferences about the timing of events gained from this image with similar information from the hundreds of other images acquired by MESSENGER to extend and refine the geological history of Mercury previously defined on the basis only of Mariner 10 images. (Courtesy NASA/JHUAPL)
Ridges and Cliffs on Mercury's Surface A complex history of geological evolution is recorded in this frame from the Narrow Angle Camera (NAC), part of the Mercury Dual Imaging System (MDIS) instrument, taken during MESSENGER's close flyby of Mercury on January 14, 2008. Part of an old, large crater occupies most of the lower left portion of the frame. An arrangement of ridges and cliffs in the shape of a "Y" crosses the crater's floor. The shadows defining the ridges are cast on the floor of the crater by the Sun shining from the right, indicating a descending stair-step of plains. The main, right-hand branch of the "Y" crosses the crater floor, the crater rim, and continues off the top edge of the picture; it appears to be a classic "lobate scarp" (irregularly shaped cliff) common in all areas of Mercury imaged so far. These lobate scarps were formed during a period when Mercury's crust was contracting as the planet cooled. In contrast, the branch of the Y to the left ends at the crater rim and is restricted to the floor of the crater. Both it and the lighter-colored ridge that extends downward from it resemble "wrinkle ridges" that are common on the large volcanic plains, or "maria," on the Moon. The MESSENGER science team is studying what features like these reveal about the interior cooling history of Mercury.
Ghostly remnants of a few craters are seen on the right side of this image, possibly indicating that once-pristine, bowl-shaped craters (like those on the large crater's floor) have been subsequently flooded by volcanism or some other plains-forming process. (Courtesy NASA/JHUAPL)
Detailed Close-up of Mercury's Previously Unseen Surface This scene was imaged by MESSENGER's Narrow Angle Camera (NAC) on the Mercury Dual Imaging System (MDIS) during the spacecraft's flyby of Mercury on January 14, 2008. The scene is part of a mosaic that covers a portion of the hemisphere not viewed by Mariner 10 during any of its three flybys (1974-1975). The surface of Mercury is revealed at a resolution of about 250 meters/pixel (about 820 feet/pixel). For this image, the Sun is illuminating the scene from the top and north is to the left.
The outer diameter of the large double ring crater at the center of the scene is about 260 km (about 160 miles). The crater appears to be filled with smooth plains material that may be volcanic in nature. Multiple chains of smaller secondary craters are also seen extending radially outward from the double ring crater. Double or multiple rings form in craters with very large diameters, often referred to as impact basins. On Mercury, double ring basins begin to form when the crater diameter exceeds about 200 km (about 125 miles); at such an onset diameter the inner rings are typically low, partial, or discontinuous. The transition diameter at which craters begin to form rings is not the same on all bodies and, although it depends primarily on the surface gravity of the planet or moon, the transition diameter can also reveal important information about the physical characteristics of surface materials. Studying impact craters, such as this one, in the more than 1200 images returned from this flyby will provide clues to the physical properties of Mercury's surface and its geological history. (Courtesy NASA/JHUAPL)
Hills of Mercury "Weird terrain" best describes this hilly, lineated region of Mercury. This area is at the antipodal point from the large Caloris basin. The shock wave produced by the Caloris impact was reflected and focused to this antipodal point, thus jumbling the crust and breaking it into a series of complex blocks. The area covered is about 100 kilometers (62 miles) on a side. (Copyright Calvin J. Hamilton; FDS 27370)
Caloris Basin Floor This image is a high resolution view of the Caloris Basin shown in the previous image. It shows ridges and fractures that increase in size towards the center of the basin (upper left). (Copyright Calvin J. Hamilton; FDS 126)
Bright Rayed Craters This image shows two prominent craters (upper right) with bright halos on Mercury. The craters are about 40 kilometers (25 miles) in diameter. The halos and rays cover other features on the surface indicating that they are some of the youngest on Mercury. (Copyright Calvin J. Hamilton; FDS 275)
Large Faults on Mercury This Mariner 10 image shows Santa Maria Rupes, the sinuous dark feature running through the crater at the center of this image. Many such features were discovered in the Mariner images of Mercury and are interpreted to be enormous thrust faults where part of the mercurian crust was pushed slightly over an adjacent part by compressional forces. The abundance and length of the thrust faults indicate that the radius of Mercury decreased by 1-2 kilometers (.6 - 1.2 miles) after the solidification and impact cratering of the surface. This volume change probably was due to the cooling of the planet, following the formation of a metallic core three-fourths the size of the planet. North is towards the top and is 200 kilometers (120 miles) across. (© Copyright 1998 by Calvin J. Hamilton; FDS 27448)
Antoniadi Ridge This is an image of a 450 kilometer (280 mile) ridge called Antoniadi. It travels along the right edge of the image, and transects a large 80 kilometer (50 mile) crater about half way in between. It crosses smooth plains to the north and intercrater plains to the south [Strom et al., 1975]. (Copyright Calvin J. Hamilton)
Double Ring Basin This image shows a double-ring basin which is 200 kilometers (120 miles) in diameter. The floor contains smooth plains material. The inner ring basin is at a lower elevation than the outer ring. (Copyright Calvin J. Hamilton; FDS 27301)
Incoming View of Mercury This photomosaic of Mercury was constructed from photos taken by Mariner 10 six hours before the spacecraft flew past the planet on March 29, 1974. These images were taken from a distance of 5,380,000 kilometers (3,340,000 miles). (Courtesy USGS, and NASA)
Mercury This two image (FDS 26850, 26856) mosaic of Mercury was constructed from photos taken by Mariner 10 a few hours before the spacecraft's closest and first encounter with the planet on March 29, 1974. (Copyright Calvin J. Hamilton)
Caloris Basin This mosaic shows the Caloris Basin (located half-way in shadow on the morning terminator). Caloris is Latin for heat and the basin is named this because it is near the subsolar point (the point closest to the sun) when Mercury is at aphelion. Caloris basin is 1,300 kilometers (800 miles) in diameter and is the largest know structure on Mercury. It was formed from an impact of a projectile with asteroid dimensions. The interior floor of the basin contains smooth plains but is highly ridged and fractured. North is towards the top of this image. (Copyright Calvin J. Hamilton; FDS 188-199)
Venus
Venus, the jewel of the sky, was once know by ancient astronomers as the morning star and evening star. Early astronomers once thought Venus to be two separate bodies. Venus, which is named after the Roman goddess of love and beauty, is veiled by thick swirling cloud cover.
Astronomers refer to Venus as Earth's sister planet. Both are similar in size, mass, density and volume. Both formed about the same time and condensed out of the same nebula. However, during the last few years scientists have found that the kinship ends here. Venus is very different from the Earth. It has no oceans and is surrounded by a heavy atmosphere composed mainly of carbon dioxide with virtually no water vapor. Its clouds are composed of sulfuric acid droplets. At the surface, the atmospheric pressure is 92 times that of the Earth's at sea-level.
Venus is scorched with a surface temperature of about 482° C (900° F). This high temperature is primarily due to a runaway greenhouse effect caused by the heavy atmosphere of carbon dioxide. Sunlight passes through the atmosphere to heat the surface of the planet. Heat is radiated out, but is trapped by the dense atmosphere and not allowed to escape into space. This makes Venus hotter than Mercury.
A Venusian day is 243 Earth days and is longer than its year of 225 days. Oddly, Venus rotates from east to west. To an observer on Venus, the Sun would rise in the west and set in the east.
Until just recently, Venus' dense cloud cover has prevented scientists from uncovering the geological nature of the surface. Developments in radar telescopes and radar imaging systems orbiting the planet have made it possible to see through the cloud deck to the surface below. Four of the most successful missions in revealing the Venusian surface are NASA's Pioneer Venus mission (1978), the Soviet Union's Venera 15 and 16 missions (1983-1984), and NASA's Magellan radar mapping mission (1990-1994). As these spacecraft began mapping the planet a new picture of Venus emerged.
Venus' surface is relatively young geologically speaking. It appears to have been completely resurfaced 300 to 500 million years ago. Scientists debate how and why this occurred. The Venusian topography consists of vast plains covered by lava flows and mountain or highland regions deformed by geological activity. Maxwell Montes in Ishtar Terra is the highest peak on Venus. The Aphrodite Terra highlands extend almost half way around the equator. Magellan images of highland regions above 2.5 kilometers (1.5 miles) are unusually bright, characteristic of moist soil. However, liquid water does not exist on the surface and cannot account for the bright highlands. One theory suggests that the bright material might be composed of metallic compounds. Studies have shown the material might be iron pyrite (also know as "fools gold"). It is unstable on the plains but would be stable in the highlands. The material could also be some type of exotic material which would give the same results but at lower concentrations.
Venus is scarred by numerous impact craters distrubuted randomly over its surface. Small craters less that 2 kilometers (1.2 miles) are almost non-existent due to the heavy Venusian atmosphere. The exception occurs when large meteorites shatter just before impact, creating crater clusters. Volcanoes and volcanic features are even more numerous. At least 85% of the Venusian surface is covered with volcanic rock. Hugh lava flows, extending for hundreds of kilometers, have flooded the lowlands creating vast plains. More than 100,000 small shield volcanoes dot the surface along with hundreds of large volcanos. Flows from volcanos have produced long sinuous channels extending for hundreds of kilometers, with one extending nearly 7,000 kilometers (4,300 miles).
Giant calderas more than 100 kilometers (62 miles) in diameter are found on Venus. Terrestrial calderas are usually only several kilometers in diameter. Several features unique to Venus include coronae and arachnoids. Coronae are large circular to oval features, encircled with cliffs and are hundreds of kilometers across. They are thought to be the surface expression of mantle upwelling. Archnoids are circular to elongated features similar to coronae. They may have been caused by molten rock seeping into surface fractures and producing systems of radiating dikes and fractures.
| Venus Statistics | |
|---|---|
| Mass (kg) | 4.869e+24 |
| Mass (Earth = 1) | .81476 |
| Equatorial radius (km) | 6,051.8 |
| Equatorial radius (Earth = 1) | .94886 |
| Mean density (gm/cm^3) | 5.25 |
| Mean distance from the Sun (km) | 108,200,000 |
| Mean distance from the Sun (Earth = 1) | 0.7233 |
| Rotational period (days) | -243.0187 |
| Orbital period (days) | 224.701 |
| Mean orbital velocity (km/sec) | 35.02 |
| Orbital eccentricity | 0.0068 |
| Tilt of axis (degrees) | 177.36 |
| Orbital inclination (degrees) | 3.394 |
| Equatorial surface gravity (m/sec^2) | 8.87 |
| Equatorial escape velocity (km/sec) | 10.36 |
| Visual geometric albedo | 0.65 |
| Magnitude (Vo) | -4.4 |
| Mean surface temperature | 482°C |
| Atmospheric pressure (bars) | 92 |
| Atmospheric composition Carbon dioxide Nitrogen Trace amounts of: Sulfur dioxide, water vapor, carbon monoxide, argon, helium, neon, hydrogen chloride, and hydrogen fluoride. | 96% 3+% |
- Rotating Venus Movie.
- Venus Topography Animation.
- Artist's view of Venus.
- Earth/Venus Rotation Movie.
- Magellan - Mapping the planet Venus.
- Flight over Western Atla Regio.
- Flight over Artemis.
- Flight over Alpha Regio.
- Flight over Western Eistla Regio.
- A dramatic view the the moon with Venus in the distance.
Venus with Visible and Radar Illumination This picture shows two different perspectives of Venus. On the left is a mosaic of images acquired by the Mariner 10 spacecraft on February 5, 1974. The image shows the thick cloud coverage that prevents optical observation of the planet's surface. The surface of Venus remained hidden until 1978 when the Pioneer Venus 1 spacecraft arrived and went into orbit about the planet on December 4th. The spacecraft used radar to map planet's surface, revealing a new Venus. Later in August of 1990 the Magellan spacecraft arrived at Venus and began its extensive planetary mapping mission. This mission produced radar images up to 300 meters per pixel in resolution. The right image show a rendering of Venus from the Pioneer Venus and Magellan radar images. (Copyright Calvin J. Hamilton)
The Interior of Venus This picture shows a cutaway view of the possible internal structure of Venus. The image was created from Mariner 10 images used for the outer atmospheric layer. The surface was taken from Magellan radar images. The interior characteristics of Venus are inferred from gravity field and magnetic field measurements by Magellan and prior spacecraft. The crust is shown as adark red, the mantle as a lighter orange-red, and the core yellow. More ... (Copyright Calvin J. Hamilton)
Mariner 10 Image of Venus This beautiful image of Venus is a mosaic of three images acquired by the Mariner 10 spacecraft on February 5, 1974. It shows the thick cloud coverage that prevents optical observation of the surface of Venus. Only through radar mapping is the surface revealed. (Copyright Calvin J. Hamilton)
Galileo Image of Venus On February 10, 1990 the Galileo spacecraft acquired this image of Venus. Only thick cloud cover can be seen. (Copyright Calvin J. Hamilton)
Hubble Image of Venus This is a Hubble Space Telescope ultraviolet-light image of the planet Venus, taken on January 24, 1995, when Venus was at a distance of 113.6 million kilometers from Earth. At ultraviolet wavelengths cloud patterns become distinctive. In particular, a horizontal "Y" shaped cloud feature is visible near the equator. The polar regions are bright, possibly showing a haze of small particles overlying the main clouds. The dark regions show the location of enhanced sulfur dioxide near the cloud tops. From previous missions, astronomers know that such features travel east to west along with the Venus' prevailing winds, to make a complete circuit around the planet in four days. (Credit: L. Esposito, University of Colorado, Boulder, and NASA)
Hemispheric View of Venus This hemispheric view of Venus, as revealed by more than a decade of radar investigations culminating in the 1990-1994 Magellan mission, is centered at 0 degrees east longitude. The effective resolution of this image is about 3 kilometers. It was processed to improve contrast and to emphasize small features, and was color-coded to represent elevation. (Courtesy NASA/USGS)
Additional Hemispheric Views of Venus
- View centered at 90°E longitude.
- View centered at 180°E longitude.
- View centered at 90°W longitude.
- View centered at the north pole.
- View centered at the south pole.
Venusian Map This image is a Mercator projection of Venusian topography. Many of the different regions have been labeled. The map extends from -66.5 to 66.5 degrees in latitude and starts at 240 degrees longitude. (Copyright Calvin J. Hamilton)
Venusian Topography Map This is another Mercator projection of Venusian topography. The map extends from -66.5 to 66.5 degrees in latitude and starts at 240 degrees longitude. A Black & White version of this image is also available. (Courtesy A.Tayfun Oner)
Gula Mons and Crater Cunitz A portion of Western Eistla Regio is displayed in this three dimensional perspective view of the surface of Venus. The viewpoint is located 1,310 kilometers (812 miles) southwest of Gula Mons at an elevation of 0.78 kilometers (0.48 mile). The view is to the northeast with Gula Mons appearing on the horizon. Gula Mons, a 3 kilometer (1.86 mile) high volcano, is located at approximately 22 degrees north latitude, 359 degrees east longitude. The impact crater Cunitz, named for the astronomer and mathematician Maria Cunitz, is visible in the center of the image. The crater is 48.5 kilometers (30 miles) in diameter and is 215 kilometers (133 miles) from the viewer's position. (Courtesy NASA/JPL)
Eistla Regio - Rift Valley A portion of Western Eistla Regio is displayed in this three dimensional perspective view of the surface of Venus. The viewpoint is located 725 kilometers (450 miles) southeast of Gula Mons. A rift valley, shown in the foreground, extends to the base of Gula Mons, a 3 kilometer (1.86 miles) high volcano. This view is facing the northwest with Gula Mons appearing at the right on the horizon. Sif Mons, a volcano with a diameter of 300 kilometers (180 miles) and a height of 2 kilometers (1.2 miles), appears to the left of Gula Mons in the background. (Courtesy NASA/JPL)
Eistla Regio A portion of Western Eistla Regio is displayed in this three dimensional perspective view of the surface of Venus. The viewpoint is located 1,100 kilometers (682 miles) northeast of Gula Mons at an elevation of 7.5 kilometers (4.6 miles). Lava flows extend for hundreds of kilometers across the fractured plains shown in the foreground, to the base of Gula Mons. This view faces the southwest with Gula Mons appearing at the left just below the horizon. Sif Mons appears to the right of Gula Mons. The distance between Sif Mons and Gula Mons is approximately 730 kilometers (453 miles). (Courtesy NASA/JPL)
Lakshmi Planum The southern scarp and basin province of western Ishtar Terra are portrayed in this three dimensional perspective view. Western Ishtar Terra is about the size of Australia and is a major focus of Magellan investigations. The highland terrain is centered on a 2.5 km to 4 km high (1.5 mi to 2.5 mi high) plateau called Lakshmi Planum which can be seen in the distance at the right. Here the surface of the plateau drops precipitously into the bounding lowlands, with steep slopes that exceed 5% over 50 km (30 mi). (Courtesy NASA/JPL)
Three-Dimensional Perspective View of Alpha Regio A portion of Alpha Regio is displayed in this three-dimensional perspective view of the surface of Venus. Alpha Regio, a topographic upland approximately 1300 kilometers across, is centered on 25 degrees south latitude, 4 degrees east longitude. In 1963, Alpha Regio was the first feature on Venus to be identified from earth-based radar. The radar-bright area of Alpha Regio is characterized by multiple sets of intersecting trends of structural features such as ridges, troughs, and flat-floored fault valleys that, together, form a polygonal outline. Directly south of the complex ridged terrain is a large ovoid-shaped feature named Eve. The radar-bright spot located centrally within Eve marks the location of the prime meridian of Venus. (Courtesy NASA/JPL)
Arachnoids Arachnoids are one of the more remarkable features found on Venus. They are seen on radar-dark plains in this Magellan image mosaic of the Fortuna region. As the name suggests, arachnoids are circular to ovoid features with concentric rings and a complex network of fractures extending outward. The arachnoids range in size from approximately 50 kilometers (29.9 miles) to 230 kilometers (137.7 miles) in diameter. Arachnoids are similar in form but generally smaller than coronae (circular volcanic structures surrounded by a set of ridges and grooves as well as radial lines). One theory concerning their origin is that they are a precursor to coronae formation. The radar-bright lines extending for many kilometers might have resulted from an upwelling of magma from the interior of the planet which pushed up the surface to form "cracks." Radar-bright lava flows are present in the 1st and 3rd image, also indicative of volcanic activity in this area. Some of the fractures cut across these flows, indicating that the flows occurred before the fractures appeared. Such relations between different structures provide good evidence for relative age dating of events. (Courtesy NASA/JPL)
Parallel Lines Two groups of parallel features that intersect almost at right angles are visible. The regularity of this terrain caused scientists to nickname it graph paper terrain. The fainter lineations are spaced at intervals of about 1 kilometer (.6 miles) and extend beyond the boundaries of the image. The brighter, more dominant lineations are less regular and often appear to begin and end where they intersect the fainter lineations. It is not yet clear whether the two sets of lineations represent faults or fractures, but in areas outside the image, the bright lineations are associated with pit craters and other volcanic features. (Courtesy Calvin J. Hamilton)
Surface Photographs from Venera 9 and 10 The Soviet Venera 9 and 10 spacecraft were launched on 8 and 14 June 1975, respectively, to do the unprecedented: place landers on the surface of Venus and return images. The Venera 9 Lander (top) touched down on the surface of Venus on October 22, 1975 at 5:13 UT, about 32° S, 291° E with the sun near zenith. It operated for 53 minutes, allowing return of a single image. Venera 9 landed on a slope inclined by about 30 degrees to the horizontal. The white object at the bottom of the image is part of the lander. The distortion is caused by the Venera imaging system. Angular and partly weathered rocks, about 30 to 40 cm across, dominate the landscape, many partly buried in soil. The horizon is visible in the upper left and right corners. The Venera 10 Lander (bottom) touched down on the surface of Venus on October 25, 1975 at 5:17 UT, about 16° N, 291° E. The Lander was inclined about 8 degrees. It returned this image during the 65 minutes of operation on the surface. The sun was near zenith during this time, and the lighting was similar to that on Earth on an overcast summer day. The objects at the bottom of the image are parts of the spacecraft. The image shows flat slabs of rock, partly covered by fine-grained material, not unlike a volcanic area on Earth. The large slab in the foreground extends over 2 meters across.
Color Surface Photographs from Venera 13 On March 1, 1982 the Venera 13 lander touched down on the Venusian surface at 7.5° S, 303° E, east of Phoebe Regio. It was the first Venera mission to include a color TV camera. Venera 13 survived on the surface for 2 hours, 7 minutes, long enough to obtain 14 images. This color panorama was produced using dark blue, green and red filters and has a resolution of 4 to 5 min. Part of the spacecraft is seen at the bottom of the image. Flat rock slabs and soil are visible. The true color is difficult to judge because the Venerian atmosphere filters out blue light. The surface composition is similar to terrestrial basalt. On the ground in the foreground is a camera lens cover. This image is the left half of the Venera 13 photo.
Earth
From the perspective we get on Earth, our planet appears to be big and sturdy with an endless ocean of air. From space, astronauts often get the impression that the Earth is small with a thin, fragile layer of atmosphere. For a space traveler, the distinguishing Earth features are the blue waters, brown and green land masses and white clouds set against a black background.
Many dream of traveling in space and viewing the wonders of the universe. In reality all of us are space travelers. Our spaceship is the planet Earth, traveling at the speed of 108,000 kilometers (67,000 miles) an hour.
Earth is the 3rd planet from the Sun at a distance of about 150 million kilometers (93.2 million miles). It takes 365.256 days for the Earth to travel around the Sun and 23.9345 hours for the Earth rotate a complete revolution. It has a diameter of 12,756 kilometers (7,973 miles), only a few hundred kilometers larger than that of Venus. Our atmosphere is composed of 78 percent nitrogen, 21 percent oxygen and 1 percent other constituents.
Earth is the only planet in the solar system known to harbor life. Our planet's rapid spin and molten nickel-iron core give rise to an extensive magnetic field, which, along with the atmosphere, shields us from nearly all of the harmful radiation coming from the Sun and other stars. Earth's atmosphere protects us from meteors, most of which burn up before they can strike the surface.
From our journeys into space, we have learned much about our home planet. The first American satellite, Explorer 1, discovered an intense radiation zone, now called the Van Allen radiation belts. This layer is formed from rapidly moving charged particles that are trapped by the Earth's magnetic field in a doughnut-shaped region surrounding the equator. Other findings from satellites show that our planet's magnetic field is distorted into a tear-drop shape by the solar wind. We also now know that our wispy upper atmosphere, once believed calm and uneventful, seethes with activity -- swelling by day and contracting by night. Affected by changes in solar activity, the upper atmosphere contributes to weather and climate on Earth.
Besides affecting Earth's weather, solar activity gives rise to a dramatic visual phenomenon in our atmosphere. When charged particles from the solar wind become trapped in Earth's magnetic field, they collide with air molecules above our planet's magnetic poles. These air molecules then begin to glow and are known as the auroras or the northern and southern lights.
| Earth Statistics | |
|---|---|
| Mass (kg) | 5.976e+24 |
| Mass (Earth = 1) | 1.0000e+00 |
| Equatorial radius (km) | 6,378.14 |
| Equatorial radius (Earth = 1) | 1.0000e+00 |
| Mean density (gm/cm^3) | 5.515 |
| Mean distance from the Sun (km) | 149,600,000 |
| Mean distance from the Sun (Earth = 1) | 1.0000 |
| Rotational period (days) | 0.99727 |
| Rotational period (hours) | 23.9345 |
| Orbital period (days) | 365.256 |
| Mean orbital velocity (km/sec) | 29.79 |
| Orbital eccentricity | 0.0167 |
| Tilt of axis (degrees) | 23.45 |
| Orbital inclination (degrees) | 0.000 |
| Equatorial escape velocity (km/sec) | 11.18 |
| Equatorial surface gravity (m/sec^2) | 9.78 |
| Visual geometric albedo | 0.37 |
| Mean surface temperature | 15°C |
| Atmospheric pressure (bars) | 1.013 |
| Atmospheric composition Nitrogen Oxygen Other | 77% 21% 2% |
- Rotation Earth Movie.
- Earth's Lights at Night.
- Earth Topography Animation.
- Aurora Video.
- Earth/Venus Rotation Movie.
- Galileo Earth Encounter.
- Earth: The Movie - Animation of Clouds & Flight.
- Earth: The Movie - Animation of Clouds.
The following set of images show some of the wonders of our planet, the Earth.
Blue Marble West This spectacular "blue marble" image is the most detailed true-color image of the entire Earth to date. Using a collection of satellite-based observations, scientists and visualizers stitched together months of observations of the land surface, oceans, sea ice, and clouds into a seamless, true-color mosaic of every square kilometer (.386 square mile) of our planet. (Courtesy NASA/MODIS/USGS)
Blue Marble East This spectacular "blue marble" image is the most detailed true-color image of the entire Earth to date. Using a collection of satellite-based observations, scientists and visualizers stitched together months of observations of the land surface, oceans, sea ice, and clouds into a seamless, true-color mosaic of every square kilometer (.386 square mile) of our planet. (Courtesy NASA/MODIS/USGS)
Earth Lights of North and South America This image of North and South America city lights was created with data from the Defense Meteorological Satellite Program (DMSP) Operational Linescan System (OLS). Originally designed to view clouds by moonlight, the OLS is also used to map the locations of permanent lights on the Earth's surface.
The brightest areas of the Earth are the most urbanized, but not necessarily the most populated. Cities tend to grow along coastlines and transportation networks. Even without the underlying map, the outlines of the continents are still be visible. The United States interstate highway system appears as a lattice connecting the brighter dots of city centers. (Copyright Calvin J. Hamilton)
Africa The crew of Apollo 17 took this photograph of Earth in December 1972 while the spacecraft was traveling between the Earth and the Moon. The orange-red deserts of Africa and Saudi Arabia stand in stark contrast to the deep blue of the oceans and the white of both clouds and snow-covered Antarctica. (Courtesy NASA)
Mariner 10's View of the Earth & Moon The Earth and Moon were imaged by Mariner 10 from 2.6 million kilometers while completing the first ever Earth-Moon encounter by a spacecraft capable of returning high resolution digital color image data. These images have been combined below to illustrate the relative sizes of the two bodies. From this particular viewpoint the Earth appears to be a water planet! (Courtesy NASA/JPL/Northwestern University)
The Earth & Moon During its flight, the Galileo spacecraft returned images of the Earth and Moon. Separate images of the Earth and Moon were combined to generate this view. The Galileo spacecraft took the images in 1992 on its way to explore the Jupiter system in 1995-97. The image shows a partial view of the Earth centered on the Pacific Ocean about latitude 20 degrees south. The west coast of South America can be observed as well as the Caribbean; swirling white cloud patterns indicate storms in the southeast Pacific. The distinct bright ray crater at the bottom of the Moon is the Tycho impact basin. The lunar dark areas are lava rock filled impact basins. This picture contains same scale and relative color/albedo images of the Earth and Moon. (Courtesy USGS/NASA)
Northeast Africa and the Arabian Peninsula This image of northeast Africa and the Arabian Peninsula was taken from an altitude of about 500,000 kilometers (300,000 miles) by the Galileo spacecraft on December 9, 1992, as it left Earth en route to Jupiter. Visible are most of Egypt (left of center), including the Nile Valley; the Red Sea (slightly above center); Israel; Jordan, and the Arabian Peninsula. In the center, below the coastal cloud, is Khartoum, at the confluence of the Blue Nile and the White Nile. Somalia (lower right) is partly covered by clouds. (Courtesy NASA/JPL)
Horn of Africa, Somalia The orange and tan colors of this high-oblique photograph of the Horn of Africa indicate an arid-to-semiarid landscape in the northern half of the east African country of Somalia. Except in the darker areas where thicker vegetation can be found, most of the vegetation in this part of Somalia is shrub brush and grasslands. The general climate of this region features hot temperatures and scarce, irregular rainfall. Two distinct drainage basins are characterized by lighter colors-the Nugaaleed Valley along the western side of the photograph and the other watershed trending toward the Hafun Peninsula, the tombolo along the east coast of Somalia. The southern extent of the Saudi Arabian Peninsula is visible north across the Gulf of Aden. (Courtesy NASA)
Southern Tip of Greenland The southern tip of Greenland is seen in this high-oblique, almost colorless, stark photograph of the world's largest island. The blackness of space contrasts sharply with the whiteness of clouds, ice, and snow. The only true color is the blue of the Atlantic Ocean and the Labrador Sea. Cloud-free conditions existing along the southern coastal area emphasize the deeply indented fjords along the coast. A close look at the white areas reveals three different features-snow and ice on the land; cloud formations over the central region and the eastern and western sides of the island; and wispy-looking ice floes off the southeast and the southwest tip of the fjord-lined coast, which are moved by the East Greenland Current to the south-southwest, and larger ice packs developing north along the east coast. Greenland has the only surviving continental glacier in the Northern Hemisphere. This ice sheet covers seven-eighths of Greenland's surface and contains an estimated 11 percent of the world's fresh water. (Courtesy NASA)
Antarctica This image of Antarctica was taken by Galileo several hours after it flew close to the Earth on December 8, 1990. This is the first picture of the whole Antarctic continent taken nearly at once from space. Galileo was about 200,000 kilometers (125,000 miles) from Earth when the pictures were taken.
The icy continent is surrounded by the dark blue of three oceans: the Pacific to the left, the Indian to the bottom, and a piece of the Atlantic to the upper right. Nearly the entire continent was sunlit at this time of year, just two weeks before southern summer solstice. The arc of dark spots extending from near the South Pole (close to the center) toward the lower left is the Transantarctic Mountain Range. To the left of the mountains is the vast Ross Ice Shelf and the shelf's sharp border with the dark waters of the Ross Sea. The thin blue line along the Earth's limb marks our planet's atmosphere. (Courtesy NASA/JPL)
Clementine Mission This false-colored image was acquired during the Clementine mission. It shows airglow of the upper atmosphere as a thin blue line. The bright spot toward the bottom is an urban area. (Courtesy Naval Research Laboratory)
Map projected image of Earth (AVHRR) This image is a Homolosine projection of the Earth prepared from Advanced Very High Resolution Radiometer (AVHRR) image data. (Courtesy ESA/NASA/NOAA/USGS/CSIRO)
USA This image is a mosaic of the United States prepared by using 16 images from the Advanced Very High Resolution Radiometer (AVHRR) sensors on the meteorological satellites NOAA-8 and NOAA-9. The images were acquired between May 24, 1984 and May 14, 1986.
On false-color infrared mosaics, vegetation appears in various tones of red instead of green. The "redness" indicates vegetation density, type and whether growing on dry land or in a swamp (a mixture of reddish vegetation and dark blue surface water produces dark tones). Grasslands appear light red, deciduous trees and croplands appear red, and coniferous forests appear dark red or maroon. Desert areas appear white and urban areas (pavement and buildings) appear bluish green. Lakes, rivers and oceans appear in various shades of blue, dark blue for deep water and light blue for shallow or turbid water. Exposed bedrock generally appears as a dark bluish-green or other dark tone. (Courtesy USGS)
Mars
Mars is the fourth planet from the Sun and is commonly referred to as the Red Planet. The rocks, soil and sky have a red or pink hue. The distinct red color was observed by stargazers throughout history. It was given its name by the Romans in honor of their god of war. Other civilizations have had similar names. The ancient Egyptians named the planet Her Descher meaning the red one.
Before space exploration, Mars was considered the best candidate for harboring extraterrestrial life. Astronomers thought they saw straight lines crisscrossing its surface. This led to the popular belief that irrigation canals on the planet had been constructed by intelligent beings. In 1938, when Orson Welles broadcasted a radio drama based on the science fiction classic War of the Worlds by H.G. Wells, enough people believed in the tale of invading Martians to cause a near panic.
Another reason for scientists to expect life on Mars had to do with the apparent seasonal color changes on the planet's surface. This phenomenon led to speculation that conditions might support a bloom of Martian vegetation during the warmer months and cause plant life to become dormant during colder periods.
In July of 1965, Mariner 4, transmitted 22 close-up pictures of Mars. All that was revealed was a surface containing many craters and naturally occurring channels but no evidence of artificial canals or flowing water. Finally, in July and September 1976, Viking Landers 1 and 2 touched down on the surface of Mars. The three biology experiments aboard the landers discovered unexpected and enigmatic chemical activity in the Martian soil, but provided no clear evidence for the presence of living microorganisms in the soil near the landing sites. According to mission biologists, Mars is self-sterilizing. They believe the combination of solar ultraviolet radiation that saturates the surface, the extreme dryness of the soil and the oxidizing nature of the soil chemistry prevent the formation of living organisms in the Martian soil. The question of life on Mars at some time in the distant past remains open.
Other instruments found no sign of organic chemistry at either landing site, but they did provide a precise and definitive analysis of the composition of the Martian atmosphere and found previously undetected trace elements.
Atmosphere
The atmosphere of Mars is quite different from that of Earth. It is composed primarily of carbon dioxide with small amounts of other gases. The six most common components of the atmosphere are:- Carbon Dioxide (CO2): 95.32%
- Nitrogen (N2): 2.7%
- Argon (Ar): 1.6%
- Oxygen (O2): 0.13%
- Water (H2O): 0.03%
- Neon (Ne): 0.00025 %
There is evidence that in the past a denser martian atmosphere may have allowed water to flow on the planet. Physical features closely resembling shorelines, gorges, riverbeds and islands suggest that great rivers once marked the planet.
Temperature and Pressure
The average recorded temperature on Mars is -63° C (-81° F) with a maximum temperature of 20° C (68° F) and a minimum of -140° C (-220° F).Barometric pressure varies at each landing site on a semiannual basis. Carbon dioxide, the major constituent of the atmosphere, freezes out to form an immense polar cap, alternately at each pole. The carbon dioxide forms a great cover of snow and then evaporates again with the coming of spring in each hemisphere. When the southern cap was largest, the mean daily pressure observed by Viking Lander 1 was as low as 6.8 millibars; at other times of the year it was as high as 9.0 millibars. The pressures at the Viking Lander 2 site were 7.3 and 10.8 millibars. In comparison, the average pressure of the Earth is 1000 millibars.
| Mars Statistics | |
|---|---|
| Mass (kg) | 6.421e+23 |
| Mass (Earth = 1) | 1.0745e-01 |
| Equatorial radius (km) | 3,397.2 |
| Equatorial radius (Earth = 1) | 5.3264e-01 |
| Mean density (gm/cm^3) | 3.94 |
| Mean distance from the Sun (km) | 227,940,000 |
| Mean distance from the Sun (Earth = 1) | 1.5237 |
| Rotational period (hours) | 24.6229 |
| Rotational period (days) | 1.025957 |
| Orbital period (days) | 686.98 |
| Mean orbital velocity (km/sec) | 24.13 |
| Orbital eccentricity | 0.0934 |
| Tilt of axis (degrees) | 25.19 |
| Orbital inclination (degrees) | 1.850 |
| Equatorial surface gravity (m/sec^2) | 3.72 |
| Equatorial escape velocity (km/sec) | 5.02 |
| Visual geometric albedo | 0.15 |
| Magnitude (Vo) | -2.01 |
| Minimum surface temperature | -140°C |
| Mean surface temperature | -63°C |
| Maximum surface temperature | 20°C |
| Atmospheric pressure (bars) | 0.007 |
| Atmospheric composition Carbon Dioxide (C02) Nitrogen (N2) Argon (Ar) Oxygen (O2) Carbon Monoxide (CO) Water (H2O) Neon (Ne) Krypton (Kr) Xenon (Xe) Ozone (O3) | 95.32% 2.7% 1.6% 0.13% 0.07% 0.03% 0.00025% 0.00003% 0.000008% 0.000003% |
- Rotating Mars Movie.
- Mars Topography Movie.
- Animation of Tharsis Tholus.
- Animation of the Olympus Mons Caldera.
- Mars Global Surveyor Animation.
- Mars the Movie.
- Flight over Valles Marineris.
- Animation of Martian Poles.
- Animation over Olympus Mons.
- Hubble Telescope full-globe animation.
Mars With Cloud Cover This image of mars came from a series of pictures taken by the Mars Global Surveyor wide angle cameras. A map was created and then wrapped around a sphere to generate this view of Mars. Here, bluish-white water ice clouds hang above the Tharsis volcanoes. (Copyright 2005 by Calvin J. Hamilton)
Large Mosaic of Mars This image is a large mosaic of the Valles Marineris [VAL-less mar-uh-NAIR-iss] hemisphere of Mars. It is a view similar to that which one would see from a spacecraft. The lower center of the scene shows the entire Valles Marineris canyon system, more than 3,000 kilometers (1,860 miles) long and up to 8 kilometers (5 miles) deep, extending from Noctis Labyrinthus, the arcuate system of graben to the west, to the chaotic terrain to the east. Many huge ancient river channels begin from the chaotic terrain and north-central canyons and run north. Many of the channels flowed into a basin called Acidalia Planitia, which is the dark area in the extreme north of this picture. The three Tharsis volcanoes (dark red spots), each about 25 kilometers (16 miles) high, are visible to the west along with Olympus Mons the largest volcano on the planet. Very ancient terrain covered by many impact craters lies to the south of Valles Marineris. The polar cap can be seen to the north. (Copyright Calvin J. Hamilton)
The Interior of Mars The current understanding of the interior of Mars suggests that it can be modeled with a thin crust, similar to Earth's, a mantle and a core. Using four parameters, the Martian core size and mass can be determined. However, only three out of the four are known and include the total mass, size of Mars, and the moment of inertia. Mass and size was determined accurately from early missions. The moment of inertia was determined from Viking lander and Pathfinder Doppler data, by measuring the precession rate of Mars. The fourth parameter, needed to complete the interior model, will be obtained from future spacecraft missions. With the three known parameters, the model is significantly constrained. If the Martian core is dense (composed of iron) similar to Earth's or SNC meteorites thought to originate from Mars, then the minimum core radius would be about 1300 kilometers. If the core is made out of less-dense material such as a mixture of sulfur and iron, the maximum radius would probably be less than 2000 kilometers. (Copyright 1998 by Calvin J. Hamilton)
Topography Map of Mars This image is a newly released topographic map of Mars. The full range of topography on Mars is about 19 miles (30 kilometers), one and a half times the range of elevations found on Earth, The most curious aspect of the map is the striking difference between the planet's low, smooth Northern Hemisphere and the heavily cratered Southern Hemisphere," which sits, on average, about three miles (five kilometers) higher than the north. (Courtesy GSFC/NASA)
Schiaparelli Hemisphere This image is a mosaic of the Schiaparelli hemisphere of Mars. The center of this image is near the impact crater Schiaparelli, 450 kilometers (280 miles) in diameter. The dark streaks with bright margins emanating from craters in the Oxie Palus region, upper left of image, are caused by erosion and/or deposition by the wind. Bright white areas to the south, including the Hellas impact basin at extreme lower right, are covered by carbon dioxide frost. (Courtesy USGS)
Central Candor Chasm - Oblique View This image shows part of Candor Chasm in Valles Marineris. It is centered at Latitude -5.0, Longitude 70.0. The view is from the north looking into the chasm. Candor Chasm's geomorphology is complex, shaped by tectonics, mass wasting, wind, and perhaps by water and volcanism. (Courtesy USGS)
West Candor Chasm (Enhanced Color) This picture (centered at latitude 4° S, longitude 76° W) shows areas of central Valles Marineris, including Candor Chasm (lower left), Ophir Chasm (lower right), and Hebes Chasm (upper right). Complex layered deposits in the canyons may have been deposited in lakes, and if so, are of great interest for future searches for fossil life on Mars. The pinkish deposits in Candor Chasm may be due to hydrothermal alterations and the production of crystalline ferric oxides. ((Geissler et al., 1993, Icarus 106,380). Viking Orbiter Picture Numbers 279B02 (violet), 279B10 (green), and 279B12 (red) at 240 meters/pixel resolution. Picture width is 231 kilometers. North is 47° clockwise from top.)
Ophir Chasma Ophir Chasma is a large west-northwest-trending trough about 100 km wide. The Chasma is bordered by 4 km high walled cliffs, most likely faults, that show spur-and-gully morphology and smooth sections. The walls have been dissected by landslides forming reentrants; one area (upper left) on the north wall shows a young landslide about 100 km wide. The volume of the landslide debris is more than 1000 times greater than that from the May 18, 1980 debris avalanche from Mount St. Helens. The longitudinal grooves seen in the foreground are thought to be due to differential shear and lateral spreading at high velocities. The landslide passes between mounds of interior layered deposits on the floor of the chasma. (Courtesy USGS)
Landslide in Valles Marineris Although Valles Marineris originated as a tectonic structure, it has been modified by other processes. This image shows a close-up view of a landslide on the south wall of Valles Marineris. This landslide partially removed the rim of the crater that is on the plateau adjacent to Valles Marineris. Note the texture of the landslide deposit where it flowed across the floor of Valles Marineris. Several distinct layers can be seen in the walls of the trough. These layers may be regions of distinct chemical composition or mechanical properties in the Martian crust. (Copyright Calvin J. Hamilton; Caption: LPI)
HST 3 Views of Mars at Opposition These Hubble Space Telescope views provide the most detailed complete global coverage of the Red Planet ever seen from Earth. The pictures were taken on February 25, 1995, when Mars was at a distance of 103 million kilometers (65 million miles). To the surprise of researchers, Mars is cloudier than seen in previous years. This means the planet is cooler and drier, because water vapor in the atmosphere freezes out to form ice-crystal clouds. The three images show the Tharsis, Valles Marineris and Syrtis Major regions. (Credit: Philip James, University of Toledo; Steven Lee, University of Colorado; and NASA)
Outflow Source of Channel Ravi Vallis This image of the head of Ravi Vallis shows a 300-kilometer (186-mile) long portion of a channel. Like many other channels that empty into the northern plains of Mars, Ravi Vallis orginates in a region of collapsed and disrupted ("chaotic") terrain within the planet's older, cratered highlands. Structures in these channels indicate that they were carved by liquid water moving at high flow rates. The abrupt beginning of the channel, with no apparent tributaries, suggests that the water was released under great pressure from beneath a confining layer of frozen ground. As this water was released and flowed away, the overlying surface collapsed, producing the disruption and subsidence shown here. Three such regions of chaotic collapsed material are seen in this image, connected by a channel whose floor was scoured by the flowing water. The flow in this channel was from west to east (left to right). This channel ultimately links up with a system of channels that flowed northward into Chryse Basin. (Copyright Calvin J. Hamilton; Caption: LPI)
Streamlined Islands The water that carved the channels to the north and east of the Valles Marineris canyon system had tremendous erosive power. One consequence of this erosion was the formation of streamlined islands where the water encountered obstacles along its path. This image shows two streamlined islands that formed as the water was diverted by two 8-10 kilometer (5-6 mile) diameter craters lying near the mouth of Ares Vallis in Chryse Planitia. The water flowed from south to north (bottom to top of the image). The height of the scarp surrounding the upper island is about 400 meters (1,300 feet), while the scarp surrounding the southern island is about 600 meters (2,000 feet) high. (Copyright Calvin J. Hamilton; Caption: LPI)
Valley Network Unlike the features shown in the above two images, many systems on Mars do not show evidence of catastrophic flooding. Instead, they show a resemblance to drainage systems on Earth, where water acts at slow rates over long periods of time. As on Earth, the channels shown here merge together to form larger channels.
However, these valley networks are less developed than typical terrestrial drainage systems, with the Martian examples lacking small-scale streams feeding into the larger valleys. Because of the absence of small-scale streams in the Martian valley networks, it is thought that the valleys were carved primarily by ground water flow rather than by runoff of rain. Although liquid water is currently unstable on the surface of Mars, theoretical studies indicate that flowing groundwater might be able to form valley networks if the water flowed beneath a protective cover of ice. Alternatively, because the valley networks are confined to relatively old regions of Mars, their presence may indicate that Mars once possessed a warmer and wetter climate in its early history. (Copyright Calvin J. Hamilton; Caption: LPI)
South Polar Cap This image shows the south polar cap of Mars as it appears near its minimum size of about 400 kilometers (249 miles). It consists mainly of frozen carbon dioxide. This carbon dioxide cap never melts completely. The ice appears reddish due to dust that has been incorporated into the cap. (Courtesy NASA)
North Polar Cap This image is an oblique view of the north polar cap of Mars. Unlike the south polar cap, the north polar cap probably consists of water-ice. (Copyright Calvin J. Hamilton)
Polar Laminated Terrain One of the discoveries of the Mariner 9 spacecraft was that the south polar cap of Mars was made of thin layers or laminations of ice and sediment. Four years later, on October 10, 1976, the Viking 2 spacecraft took this picture of the Martian north polar cap. The visible layering occurred as a result of wind born dust settling upon the polar cap. As the caps experience climatic variations, they expand and contract. The layers of dust sediment tend to grow thicker near the poles where ice deposits remain for longer periods of time. The thickness of the deposits indicates they were formed during cyclical climatic variation rather than annual changes. As ice withdraws from a region, wind exposes the layers sculpting valleys and scarps. The formation of layered deposits is an active process today. (Copyright 1998 by Calvin J. Hamilton)
Dunefield This image shows several dune types which are found in the north circumpolar dunefield. This thumnail image shows a section of transverse dunes. The full image has a field of traverse dunes on the left and barchan dunes on the right with a transition zone inbetween. Transverse dunes are oriented perpendicular to the prevailing wind direction. They are long and linear, and frequently join their neighbor in a low-angle "Y" junction. Barchan dunes are crescent-shaped mounds with downwind-pointing horns. These dunes are comparable in size to the largest dunes found on the Earth. (Copyright Calvin J. Hamilton)
Local Dust Storm Local dust storms are relatively common on Mars. They tend to occur in areas of high topographic and/or high thermal gradients (usually near the polar caps), where surface winds would be strongest. This storm is several hundreds of kilometers in extent and is located near the edge of the south polar cap. Some local storms grow larger, others die out. (Copyright Calvin J. Hamilton; caption by LPI)
White Rock This image shows a lesser known, but unusual feature on Mars. It is commonly called "White Rock". The white feature is eroded crater fill, but exactly how it was formed has not been satisfactorily explained. White Rock was not formed by polar processes because it lies near to the equator at latitude -8 degrees and longitude 355 degrees. It has been modified through aeolian erosion showing transverse and longitudinal erosional features. (Copyright 1998 by Calvin J. Hamilton)
Martian Atmosphere This oblique image taken by the Viking orbiter spacecraft shows a thin band of the Martian atmosphere. This image looks northeast across the Argyre basin. The Argyre basin is about 600 kilometers across with a rugged rim of about 500 kilometers in width. (Copyright 1997 by Calvin J. Hamilton)
The following table summarizes the radius, mass, distance from the planet center, discoverer and the date of discovery of each of the moons of Mars:
| Moon | # | Radius (km) | Mass (kg) | Distance (km) | Discoverer | Date |
|---|---|---|---|---|---|---|
| Phobos | I | 13.5x10.8x9.4 | 1.08e+16 | 9,380 | A. Hall | 1877 |
| Deimos | II | 7.5x6.1x5.5 | 1.80e+15 | 23,460 | A. Hall | 1877 |
Jupiter
Jupiter is the fifth planet from the Sun and is the largest planet in the solar system. If Jupiter were hollow, more than one thousand Earths could fit inside. It also contains two and a half times the mass of all the other planets combined. It has a mass of 1.9 x 1027 kg and is 142,800 kilometers (88,736 miles) across the equator. Jupiter possesses 62 known satellites. The four largest are Callisto, Europa, Ganymede and Io, and were named after Galileo Galilei who observed them as long ago as 1610. The German astronomer Simon Marius claimed to have seen the moons around the same time, but he did not publish his observations and so Galileo is given the credit for their discovery.
Jupiter has a very faint ring system, but is totally invisible from the Earth. (The rings were discovered in 1979 by Voyager 1.) The atmosphere is very deep, perhaps comprising the whole planet, and is somewhat like the Sun. It is composed mainly of hydrogen and helium, with small amounts of methane, ammonia, water vapor and other compounds. At great depths within Jupiter, the pressure is so great that the hydrogen atoms are broken up and the electrons are freed so that the resulting atoms consist of bare protons. This produces a state in which the hydrogen becomes metallic.
Colorful latitudinal bands, atmospheric clouds and storms illustrate Jupiter's dynamic weather systems. The cloud patterns change within hours or days. The Great Red Spot is a complex storm moving in a counter-clockwise direction. At the outer edge, material appears to rotate in four to six days; near the center, motions are small and nearly random in direction. An array of other smaller storms and eddies can be found through out the banded clouds.
Auroral emissions, similar to Earth's northern lights, were observed in the polar regions of Jupiter. The auroral emissions appear to be related to material from Io that spirals along magnetic field lines to fall into Jupiter's atmosphere. Cloud-top lightning bolts, similar to superbolts in Earth's high atmosphere, were also observed.
Jupiter's Ring
Unlike Saturn's intricate and complex ring patterns, Jupiter has a simple ring system that is composed of an inner halo, a main ring and a Gossamer ring. To the Voyager spacecraft, the Gossamer ring appeared to be a single ring, but Galileo imagery provided the unexpected discovery that Gossamer is really two rings. One ring is embedded within the other. The rings are very tenuous and are composed of dust particles kicked up as interplanetary meteoroids smash into Jupiter's four small inner moons Metis, Adrastea, Thebe, and Amalthea. Many of the particles are microscopic in size.The innermost halo ring is toroidal in shape and extends radially from about 92,000 kilometers (57,000 miles) to about 122,500 kilometers (76,000 miles) from Jupiter's center. It is formed as fine particles of dust from the main ring's inner boundary 'bloom' outward as they fall toward the planet. The main and brightest ring extends from the halo boundary out to about 128,940 kilometers (80,000 miles) or just inside the orbit of Adrastea. Close to the orbit of Metis, the main ring's brightness decreases.
The two faint Gossamer rings are fairly uniform in nature. The innermost Amalthea Gossamer ring extends from the orbit of Adrastea out to the orbit of Amalthea at 181,000 kilometers (112,000 miles) from Jupiter's center. The fainter Thebe Gossamer ring extends from Amalthea's orbit out to about Thebe's orbit at 221,000 kilometers (136,000 miles).
Jupiter's rings and moons exist within an intense radiation belt of electrons and ions trapped in the planet's magnetic field. These particles and fields comprise the jovian magnetosphere or magnetic environment, which extends 3 to 7 million kilometers (1.9 to 4.3 million miles) toward the Sun, and stretches in a windsock shape at least as far as Saturn's orbit - a distance of 750 million kilometers (466 million miles).
| Jupiter Statistics | |
|---|---|
| Mass (kg) | 1.900e+27 |
| Mass (Earth = 1) | 3.1794e+02 |
| Equatorial radius (km) | 71,492 |
| Equatorial radius (Earth = 1) | 1.1209e+01 |
| Mean density (gm/cm^3) | 1.33 |
| Mean distance from the Sun (km) | 778,330,000 |
| Mean distance from the Sun (Earth = 1) | 5.2028 |
| Rotational period (days) | 0.41354 |
| Orbital period (days) | 4332.71 |
| Mean orbital velocity (km/sec) | 13.07 |
| Orbital eccentricity | 0.0483 |
| Tilt of axis (degrees) | 3.13 |
| Orbital inclination (degrees) | 1.308 |
| Equatorial surface gravity (m/sec^2) | 22.88 |
| Equatorial escape velocity (km/sec) | 59.56 |
| Visual geometric albedo | 0.52 |
| Magnitude (Vo) | -2.70 |
| Mean cloud temperature | -121°C |
| Atmospheric pressure (bars) | 0.7 |
| Atmospheric composition Hydrogen Helium | 90% 10% |
- Rotating Jupiter Movie.
- Io Fly Around.
- Rotating Jupiter and its Atmosphere.
- Jupiter's Atmosphere.
- Jupiter's Redspot.
- Magnetic Field of Jupiter.
Jupiter This image was taken by NASA's Hubble Space Telescope on February 13, 1995. The image provides a detailed look at a unique cluster of three white oval-shaped storms that lie southwest (below and to the left) of Jupiter's Great Red Spot. The appearance of the clouds, in this image, is considerably different from their appearance only seven months earlier. These features are moving closer together as the Great Red Spot is carried westward by the prevailing winds while the white ovals are swept eastward.
The outer two of the white storms formed in the late 1930s. In the centers of these cloud systems the air is rising, carrying fresh ammonia gas upward. New, white ice crystals form when the upwelling gas freezes as it reaches the chilly cloud top level where temperatures are -130°C (-200°F). The intervening white storm center, the ropy structure to the left of the ovals, and the small brown spot have formed in low pressure cells. The white clouds sit above locations where gas is descending to lower, warmer regions.
Cassini Jupiter Portrait This true color mosaic of Jupiter was constructed from images taken by the Cassini spacecraft on December 29, 2000, during its closest approach to the giant planet at a distance of approximately 10 million kilometers (6.2 million miles).
It is the most detailed global color portrait of Jupiter ever produced; the smallest visible features are approximately 60 kilometers (37 miles) across. The mosaic is composed of 27 images: nine images were required to cover the entire planet in a tic-tac-toe pattern, and each of those locations was imaged in red, green, and blue to provide true color. Although Cassini's camera can see more colors than humans can, Jupiter's colors in this new view look very close to the way the human eye would see them.
Everything visible on the planet is a cloud. The parallel reddish-brown and white bands, the white ovals, and the large Great Red Spot persist over many years despite the intense turbulence visible in the atmosphere. The most energetic features are the small, bright clouds to the left of the Great Red Spot and in similar locations in the northern half of the planet. These clouds grow and disappear over a few days and generate lightning. Streaks form as clouds are sheared apart by Jupiter's intense jet streams that run parallel to the colored bands. The prominent dark band in the northern half of the planet is the location of Jupiter's fastest jet stream, with eastward winds of 480 kilometers (300 miles) per hour. Jupiter's diameter is eleven times that of Earth, so the smallest storms on this mosaic are comparable in size to the largest hurricanes on Earth.
Unlike Earth, where only water condenses to form clouds, Jupiter's clouds are made of ammonia, hydrogen sulfide, and water. The updrafts and downdrafts bring different mixtures of these substances up from below, leading to clouds at different heights. The brown and orange colors may be due to trace chemicals dredged up from deeper levels of the atmosphere, or they may be byproducts of chemical reactions driven by ultraviolet light from the Sun. Bluish areas, such as the small features just north and south of the equator, are areas of reduced cloud cover, where one can see deeper. (Courtesy NASA/JPL/Space Science Institute)
The Interior of Jupiter This picture illustrates the internal structure of Jupiter. The outer layer is primarily composed of molecular hydrogen. At greater depths the hydrogen starts resembling a liquid. At 10,000 kilometers below Jupiter's cloud top liquid hydrogen reaches a pressure of 1,000,000 bar with a temperature of 6,000° K. At this state hydrogen changes into a phase of liquid metallic hydrogen. In this state, the hydrogen atoms break down yeilding ionized protons and electrons similar to the Sun's interior. Below this is a layer dominated by ice where "ice" denotes a soupy liquid mixture of water, methane, and ammonia under high temperatures and pressures. Finally at the center is a rocky or rocky-ice core of up to 10 Earth masses. (Copyright Calvin J. Hamilton)
Thin Crescent Image of Jupiter This thin crescent picture of Jupiter was created from a photomosaic of images Galileo took on its C9 orbit. It is made from Near Infrared and Violet images, with an artificial green image produced from the other two. (Courtesy of Ted Stryk)
Nordic Optical Telescope This image of Jupiter was taken with the 2.6 meter Nordic Optical Telescope, located at La Palma, Canary Islands. It is a good example of the best imagery that can be obtained from earth based telescopes. (c) Nordic Optical Telescope Scientific Association (NOTSA).
Jupiter with Satellites Io and Europa Voyager 1 took this photo of Jupiter and two of its satellites (Io, left, and Europa, right) on Feb. 13, 1979. In this view, Io is about 350,000 kilometers (220,000 miles) above Jupiter's Great Red Spot, while Europa is about 600,000 kilometers (373,000 miles) above Jupiter's clouds. Jupiter is about 20 million kilometers (12.4 million miles) from the spacecraft at the time of this photo. There is evidence of circular motion in Jupiter's atmosphere. While the dominant large scale motions are west-to-east, small scale movement includes eddy like circulation within and between the bands. (Courtesy NASA/JPL)
Satellite Footprints Seen in Jupiter Aurora In this Hubble Space Telescope picture, a curtain of glowing gas is wrapped around Jupiter's north pole like a lasso. This curtain of light, called an aurora, is produced when high-energy electrons race along the planet's magnetic field and into the upper atmosphere where they excite atmospheric gases, causing them to glow. The aurora resembles the same phenomenon that crowns Earth's polar regions. But this Hubble image, taken in ultraviolet light, also shows the glowing "footprints" of three of Jupiter's largest moons: Io, Ganymede, and Europa.
Courtesy of NASA/ESA, John Clarke (University of Michigan)
Jupiter's Magnetosphere This image taken by the ion and neutral mass spectrometer instrument on NASA's Cassini spacecraft makes the huge magnetosphere surrounding Jupiter visible in a way no instrument on any previous spacecraft has been able to do. The magnetosphere is a bubble of charged particles trapped within the magnetic environment of the planet. A magnetic field is sketched over the image to place the energetic neutral atom emissions in perspective. This sketch extends in the horizontal plane to a width 30 times the radius of Jupiter. Also shown for scale and location are the disk of Jupiter (black circle) and the approximate position (yellow circles) of the doughnut-shaped torus created from material spewed out by volcanoes on Io.
Some of the fast-moving ions within the magnetosphere pick up electrons to become neutral atoms, and once they become neutral, they can escape Jupiter's magnetic field, flying out from the magnetosphere at speeds of thousands of kilometers, or miles, per second.
Jupiter's Auroras These HST images, reveal changes in Jupiter's auroral emissions and how small auroral spots just outside the emission rings are linked to the planet's volcanic moon, Io. The top panel pinpoints the effects of emissions from Io. The image on the left, shows how Io and Jupiter are linked by an invisible electrical current of charged particles called a flux tube. The particles, ejected from Io by volcanic eruptions, flow along Jupiter's magnetic field lines, which thread through Io, to the planet's north and south magnetic poles.
The top-right image shows Jupiter's auroral emissions at the north and south poles. Just outside these emissions are the auroral spots called "footprints." The spots are created when the particles in Io's "flux tube" reach Jupiter's upper atmosphere and interact with hydrogen gas, making it fluoresce.
The two ultraviolet images at the bottom of the picture show how the auroral emissions change in brightness and structure as Jupiter rotates. These false-color images also reveal how the magnetic field is offset from Jupiter's spin axis by 10 to 15 degrees. In the right image, the north auroral emission is rising over the left limb; the south auroral oval is beginning to set. The image on the left, obtained on a different date, shows a full view of the north aurora, with a strong emission inside the main auroral oval.
Credits: John T. Clarke and Gilda E. Ballester (University of Michigan), John Trauger and Robin Evans (Jet Propulsion Laboratory), and NASA.
The Great Red Spot This dramatic view of Jupiter's Great Red Spot and its surroundings was obtained by Voyager 1 on Feb. 25, 1979, when the spacecraft was 9.2 million kilometers (5.7 million miles) from Jupiter. Cloud details as small as 160 kilometers (100 miles) across can be seen here. The colorful, wavy cloud pattern to the left of the Red Spot is a region of extraordinarily complex and variable wave motion. (Courtesy NASA)
False Color of Jupiter's Great Red Spot This image is a false color representation of Jupiter's Great Red Spot taken with Galileo's imaging system through three different near-infrared filters. This is a mosaic of eighteen images (6 in each filter) that were taken over a period of 6 minutes on June 26, 1996. The Great Red Spot appears pink and the surrounding region blue because of the particular color coding used in this representation. The red channel is the reflectance of Jupiter at a wavelength where methane strongly absorbs (889nm). Because of this absorption, only high clouds can reflect sunlight in this wavelength. The green channel is the reflectance in a wavelength where methane absorbs, but less strongly (727nm). Lower clouds can reflect sunlight in this wavelength. Finally, the blue channel is the reflectance in a wavelength where there are essentially no absorbers in the Jovian atmosphere (756nm) and one sees light reflected from the deepest clouds. Thus, the color of a cloud in this image indicates its height, with red or white being highest and blue or black being lowest. This image shows the Great Red Spot to be relatively high, as are some smaller clouds to the northeast and northwest that are surprisingly like towering thunderstorms found on earth. The deepest clouds are in the collar surrounding the Great Red Spot, and also just to the northwest of the high (bright) cloud in the northwest corner of the image. Preliminary modelling shows these cloud heights to range about 50km in altitude. (Courtesy NASA/JPL)
Ring of Jupiter The ring of Jupiter was discovered by Voyager 1 in March of 1979. This image was taken by Voyager 2 and has been pseudo colored. The Jovian ring is about 6,500 kilometers (4,000 miles) wide and probably less than 10 kilometers (6.2 miles) thick. (Copyright Calvin J. Hamilton)
The Jovian System The best of the Jupiter system is pictured in this collage of images acquired by the Voyager and Galileo spacecraft. Jupiter is the largest planet in our solar system. The four largest moons of Jupiter are known as the Galilean moons and are named Callisto, Ganymede, Europa, and Io. Inside the orbits of the Galilean moons are Thebe, Amalthea, Adrastea, and Metis. At the lower right is shown the Valhalla region of Callisto. Ganymede is toward the bottom middle. Europa is a little above and to the right of Ganymede. Io is the top, left-most moon. Between Io and Jupiter are four little moons. The top-most little moon is Amalthea. Below and to the right of Amalthea are Metis and Adrastea. To the left of Adrastea is Thebe. (Copyright Calvin J. Hamilton)
Moons of Jupiter This image shows to scale Jupiter's moons Amalthea, Io, Europa, Ganymede, and Callisto. (Copyright Calvin J. Hamilton)
| Name | Distance* | Width | Thickness | Mass | Albedo |
|---|---|---|---|---|---|
| Halo | 92,000 km | 30,500 km | 20,000 km | ? | 0.05 |
| Main | 122,500 km | 6,440 km | < 30 km | 1 x 10^13 kg | 0.05 |
| Inner Gossamer | 128,940 km | 52,060 km | ? | ? | 0.05 |
| Outer Gossamer | 181,000 km | 40,000 km | ? | ? | 0.05 |
Over the course of the following centuries another 12 moons were discovered bringing the total to 16. During the last few years the total number of satellites that have discovered is 62. Provisional designators are given until they are officially confirmed and named. Finally in 1979, the strangeness of these frozen new worlds was brought to light by the Voyager spacecrafts as they swept past the Jovian system. Again in 1996, the exploration of these worlds took a large step forward as the Galileo spacecraft began its long term mission of observing Jupiter and its moons.
Most of Jupiter's moons are relatively small and seem to have been more likely captured than to have been formed in orbit around Jupiter. The four large Galilean moons, Io, Europa, Ganymede and Callisto, are believed to have accreted as part of the process by which Jupiter itself formed. The following table summarizes the radius, mass, distance from the planet center, discoverer and the date of discovery of each of the moons of Jupiter:
| Moon | # | Radius (km) | Mass (kg) | Distance (km) | Discoverer | Date |
|---|---|---|---|---|---|---|
| Io | I | 1,815 | 8.94e+22 | 421,600 | Marius-Galileo | 1610 |
| Europa | II | 1,569 | 4.80e+22 | 670,900 | Marius-Galileo | 1610 |
| Ganymede | III | 2,631 | 1.48e+23 | 1,070,000 | Marius-Galileo | 1610 |
| Callisto | IV | 2,400 | 1.08e+23 | 1,883,000 | Marius-Galileo | 1610 |
| Amalthea | V | 135x84x75 | 7.17e+18 | 181,300 | E. Barnard | 1892 |
| Himalia | VI | 93 | 9.56e+18 | 11,480,000 | C. Perrine | 1904 |
| Elara | VII | 38 | 7.77e+17 | 11,737,000 | C. Perrine | 1905 |
| Pasiphae | VIII | 25 | 1.91e+17 | 23,500,000 | P. Melotte | 1908 |
| Sinope | IX | 18 | 7.77e+16 | 23,700,000 | S. Nicholson | 1914 |
| Lysithea | X | 18 | 7.77e+16 | 11,720,000 | S. Nicholson | 1938 |
| Carme | XI | 20 | 9.56e+16 | 22,600,000 | S. Nicholson | 1938 |
| Ananke | XII | 15 | 3.82e+16 | 21,200,000 | S. Nicholson | 1951 |
| Leda | XIII | 8 | 5.68e+15 | 11,094,000 | C. Kowal | 1974 |
| Thebe | XIV | 55x45 | 7.77e+17 | 221,895 | S. Synnott | 1979 |
| Adrastea | XV | 12.5x10x7.5 | 1.91e+16 | 128,971 | Jewitt-Danielson | 1979 |
| Metis | XVI | 20 | 9.56e+16 | 127,969 | S. Synnott | 1979 |
| Callirrhoe | XVII | 2.4 | ? | 24,296,,000 | Spacewatch | 1999 |
| S/1975 J1 S/2000 J1 | 4 | ? | 7,435,000 | Sheppard et al | 2000 | |
| S/2000 J11 | 2 | ? | 12,654,000 | Sheppard et al | 2000 | |
| S/2000 J10 | 1.9 | ? | 20,375,000 | Sheppard et al | 2000 | |
| S/2000 J3 | 2.6 | ? | 20.733,000 | Sheppard et al | 2000 | |
| S/2000 J5 | 2.2 | ? | 21,019,000 | Sheppard et al | 2000 | |
| S/2000 J7 | 3.4 | ? | 21,162,000 | Sheppard et al | 2000 | |
| S/2000 J9 | 2.5 | ? | 21,734,000 | Sheppard et al | 2000 | |
| S/2000 J4 | 1.6 | ? | 21,948,000 | Sheppard et al | 2000 | |
| S/2000 J6 | 1.9 | ? | 22,806,000 | Sheppard et al | 2000 | |
| S/2000 J8 | 2.7 | ? | 23,521,000 | Sheppard et al | 2000 | |
| S/2000 J2 | 2.6 | ? | 24,164,000 | Sheppard et al | 2000 |
Saturn
Saturn is the sixth planet from the Sun and is the second largest in the solar system with an equatorial diameter of 119,300 kilometers (74,130 miles). Much of what is known about the planet is due to the Voyager explorations in 1980-81. Saturn is visibly flattened at the poles, a result of the very fast rotation of the planet on its axis. Its day is 10 hours, 39 minutes long, and it takes 29.5 Earth years to revolve about the Sun. The atmosphere is primarily composed of hydrogen with small amounts of helium and methane. Saturn is the only planet less dense than water (about 30 percent less). In the unlikely event that a large enough ocean could be found, Saturn would float in it. Saturn's hazy yellow hue is marked by broad atmospheric banding similar to, but fainter than, that found on Jupiter.
The wind blows at high speeds on Saturn. Near the equator, it reaches velocities of 500 meters a second (1,100 miles an hour). The wind blows mostly in an easterly direction. The strongest winds are found near the equator and velocity falls off uniformly at higher latitudes. At latitudes greater than 35 degrees, winds alternate east and west as latitude increases.
Saturn's ring system makes the planet one of the most beautiful objects in the solar system. The rings are split into a number of different parts, which include the bright A and B rings and a fainter C ring. The ring system has various gaps. The most notable gap is the Cassini [kah-SEE-nee] Division, which separates the A and B rings. Giovanni Cassini discovered this division in 1675. The Encke [EN-kee] Division, which splits the A Ring, is named after Johann Encke, who discovered it in 1837. Space probes have shown that the main rings are really made up of a large number of narrow ringlets. The origin of the rings is obscure. It is thought that the rings may have been formed from larger moons that were shattered by impacts of comets and meteoroids. The ring composition is not known for certain, but the rings do show a significant amount of water. They may be composed of icebergs and/or snowballs from a few centimeters to a few meters in size. Much of the elaborate structure of some of the rings is due to the gravitational effects of nearby satellites. This phenomenon is demonstrated by the relationship between the F-ring and two small moons that shepherd the ring material.
Radial, spoke-like features in the broad B-ring were also found by the Voyagers. The features are believed to be composed of fine, dust-size particles. The spokes were observed to form and dissipate in the time-lapse images taken by the Voyagers. While electrostatic charging may create spokes by levitating dust particles above the ring, the exact cause of the formation of the spokes is not well understood.
Saturn has 30 named satellites and more continue to be discovered.
| Saturn Statistics | |
|---|---|
| Mass (kg) | 5.688e+26 |
| Mass (Earth = 1) | 9.5181e+01 |
| Equatorial radius (km) | 60,268 |
| Equatorial radius (Earth = 1) | 9.4494e+00 |
| Mean density (gm/cm^3) | 0.69 |
| Mean distance from the Sun (km) | 1,429,400,000 |
| Mean distance from the Sun (Earth = 1) | 9.5388 |
| Rotational period (hours) | 10.233 |
| Orbital period (years) | 29.458 |
| Mean orbital velocity (km/sec) | 9.67 |
| Orbital eccentricity | 0.0560 |
| Tilt of axis (degrees) | 25.33 |
| Orbital inclination (degrees) | 2.488 |
| Equatorial surface gravity (m/sec^2) | 9.05 |
| Equatorial escape velocity (km/sec) | 35.49 |
| Visual geometric albedo | 0.47 |
| Magnitude (Vo) | 0.67 |
| Mean cloud temperature | -125°C |
| Atmospheric pressure (bars) | 1.4 |
| Atmospheric composition Hydrogen Helium | 97% 3% |
- Saturn Fly Around.
- Saturn's spokes in rings.
- 60-HST exposures showing a storm in the atmosphere of Saturn.
The Greatest Saturn Portrait ...Yet While cruising around Saturn in early October 2004, Cassini captured a series of images that have been composed into the largest, most detailed, global natural color view of Saturn and its rings ever made.
This grand mosaic consists of 126 images acquired in a tile-like fashion, covering one end of Saturn's rings to the other and the entire planet in between. The images were taken over the course of two hours on Oct. 6, 2004, while Cassini was approximately 6.3 million kilometers (3.9 million miles) from Saturn. Since the view seen by Cassini during this time changed very little, no re-projection or alteration of any of the images was necessary.
Three images (red, green and blue) were taken of each of 42 locations, or "footprints," across the planet. The full color footprints were put together to produce a mosaic that is 8,888 pixels across and 4,544 pixels tall.
The smallest features seen here are 38 kilometers (24 miles) across. Many of Saturn's splendid features noted previously in single frames taken by Cassini are visible in this one detailed, all-encompassing view: subtle color variations across the rings, the thread-like F ring, ring shadows cast against the blue northern hemisphere, the planet's shadow making its way across the rings to the left, and blue-grey storms in Saturn's southern hemisphere to the right. Tiny Mimas and even smaller Janus are both faintly visible at the lower left. The Sun-Saturn-Cassini, or phase, angle at the time was 72 degrees; hence, the partial illumination of Saturn in this portrait. Later in the mission, when the spacecraft's trajectory takes it far from Saturn and also into the direction of the Sun, Cassini will be able to look back and view Saturn and its rings in a more fully-illuminated geometry. (Courtesy NASA/JPL/Space Science Institute)
Neon Saturn Flying over the unlit side of Saturn's rings, the Cassini spacecraft captures Saturn's glow, represented in brilliant shades of electric blue, sapphire and mint green, while the planet's shadow casts a wide net on the rings.
On the night side (right side of image), with no sunlight, Saturn's own thermal radiation lights things up. This light at 5.1 microns wavelength (some seven times the longest wavelength visible to the human eye) is generated deep within Saturn, and works its way upward, eventually escaping into space. Thick clouds deep in the atmosphere block that light. An amazing array of dark streaks, spots, and globe-encircling bands is visible instead. Saturn's strong thermal glow at 5.1 microns even allows these deep clouds to be seen on portions of the dayside (left side), especially where overlying hazes are thin and the glint of the sun off of them is minimal. These deep clouds are likely made of ammonium hydrosulfide and cannot be seen in reflected light on the dayside, since the glint of the sun on overlying hazes and ammonia clouds blocks the view of this level.
A pronounced difference in the brightness between the northern and southern hemispheres is apparent. The northern hemisphere is about twice as bright as the southern hemisphere. This is because high-level, fine particles are about half as prevalent in the northern hemisphere as in the south. These particles block Saturn's glow more strongly, making Saturn look brighter in the north. [ more ] (Courtesy NASA/JPL/University of Arizona)
Saturn With Rhea and Dione NASA's Voyager 2 took this photograph of Saturn on July 21, 1981, when the spacecraft was 33.9 million kilometers (21 million miles) from the planet. Two bright, presumably convective cloud patterns are visible in the mid-northern hemisphere and several dark spoke-like features can be seen in the broad B-ring (left of planet). The moons, Rhea and Dione, appear as blue dots to the south and southeast of Saturn, respectively. Voyager 2 made its closest approach to Saturn on August 25, 1981. (Courtesy NASA/JPL)
The Interior of Saturn This picture illustrates the internal structure of Saturn. The outer layer is primarily composed of molecular hydrogen. As we go deeper where the presure reaches 100,000 bars, the gas starts to resemble a hot liquid. When the hydrogen reaches a pressure of 1,000,000 bar, hydrogen changes into a new state of metallic hydrogen. In this state it resembles a molten metal. This metalic hydrogen state occurs at about half of Saturn's radius. Below this is a layer dominated by ice where "ice" denotes a soupy liquid mixture of water, methane, and ammonia under high temperatures and pressures. Finally at the center is a rocky or rocky-ice core. (Copyright 2002 Calvin J. Hamilton)
Saturn With Tethys and Dione Saturn and two of its moons, Tethys (above) and Dione, were photographed by Voyager 1 on November 3, 1980, from a distance of 13 million kilometers (8 million miles). The shadows of Saturn's three bright rings and Tethys are cast onto the cloud tops. The limb of the planet can be seen easily through the 3,500-kilometer-wide (2,170 mile) Cassini Division, which separates ring A from ring B. The view through the much narrower Encke Division, near the outer edge of ring A is less clear. Beyond the Encke Division (at left) is the faintest of Saturn's three bright rings, the C-ring or crepe ring, barely visible against the planet. (Courtesy NASA/JPL)
Saturn's Blue Cranium Saturn's northern hemisphere is presently a serene blue, more befitting of Uranus or Neptune, as seen in this natural color image from Cassini.
Light rays here travel a much longer path through the relatively cloud-free upper atmosphere. Along this path, shorter wavelength blue light rays are scattered effectively by gases in the atmosphere, and it is this scattered light that gives the region its blue appearance. Why the upper atmosphere in the northern hemisphere is so cloud-free is not known, but may be related to colder temperatures brought on by the ring shadows cast there.
Shadows cast by the rings surround the pole, looking almost like dark atmospheric bands. The ring shadows at higher latitudes correspond to locations on the ringplane that are farther from the planet--in other words, the northernmost ring shadow in this view is made by the outer edge of the A ring. (Courtesy NASA/JPL/Space Science Institute)
Nordic Optical Telescope This image of Saturn was taken with the 2.6 meter Nordic Optical Telescope, located at La Palma, Canary Islands. (© Copyright Nordic Optical Telescope Scientific Association -- NOTSA)
Saturn's Rings Edge-On In one of nature's most dramatic examples of "now-you see-them, now-you-don't," NASA's Hubble Space Telescope captured Saturn on May 22, 1995, as the planet's magnificent ring system turned edge-on. This ring-plane crossing occurs approximately every 15 years when the Earth passes through Saturn's ring plane.
The rings do not disappear completely because the edge of the rings reflects sunlight. The dark band across the middle of Saturn is the shadow of the rings cast on the planet (the Sun is almost 3 degrees above the ring plane.) The bright stripe directly above the ring shadow is caused by sunlight reflected off the rings onto Saturn's atmosphere. Two of Saturn's icy moons are visible as tiny starlike objects in or near the ring plane.
Storm on Saturn This image, taken by the Hubble Space Telescope, shows a rare storm that appears as a white arrowhead-shaped feature near the planet's equator. The storm is generated by an upwelling of warmer air, similar to a terrestrial thunderhead. The east-west extent of this storm is equal to the diameter of the Earth (about 12,700 kilometers or 7,900 miles). The Hubble images are sharp enough to reveal that Saturn's prevailing winds shape a dark "wedge" that eats into the western (left) side of the bright central cloud. The planet's strongest eastward winds, clocked at 1,600 kilometers (1,000 miles) per hour based on Voyager spacecraft images taken in 1980-81, are at the latitude of the wedge.
To the north of this arrowhead-shaped feature, the winds decrease so that the storm center is moving eastward relative to the local flow. The clouds expanding north of the storm are swept westward by the winds at higher latitudes. The strong winds near the latitude of the dark wedge blow over the northern part of the storm, creating a secondary disturbance that generates the faint white clouds to the east (right) of the storm center. The storm's white clouds are ammonia ice crystals that form when an upward flow of warmer gases shoves its way through Saturn's frigid cloud tops.
HST Views Aurora on Saturn The top image shows the first image ever taken of bright aurorae at Saturn's northern and southern poles, as seen in far ultraviolet light by the Hubble Space Telescope. Hubble resolves a luminous, circular band centered on the north pole, where an enormous auroral curtain rises as far as 2,000 kilometers (1,200 miles) above the cloudtops. This curtain changed rapidly in brightness and extent over the two hour period of HST observations.
The aurora is produced as trapped charged particles precipitating from the magnetosphere collide with atmospheric gases. As a result of the bombardment, Saturn's gases glow at far-ultraviolet wavelengths (110-160 nanometers). These wavelengths are absorbed by the Earth's atmosphere, and can only be observed from space-based telescopes.
For comparison, the bottom image is a visible-light color composite of Saturn as seen by Hubble on December 1, 1994. Unlike the ultraviolet image, Saturn's familiar atmospheric belts and zones are clearly seen. The lower cloud deck is not visible at UV wavelengths because sunlight is reflected from higher in the atmosphere.
Last View of Saturn Two days after its encounter with Saturn, Voyager 1 looked back on the planet from a distance of more than 5.0 million kilometers (3.0 million miles). This view of Saturn has never been seen by an earth based telescope, since the earth is so close to the Sun only the sunlit face of Saturn can be seen. (Copyright © 2002 Calvin J. Hamilton)
False Color Image of Saturn's Rings Possible variations in chemical composition from one part of Saturn's ring system to another are visible in this Voyager 2 picture as subtle color variations that can be recorded with special computer-processing techniques. This highly enhanced color view was assembled from clear, orange and ultraviolet frames obtained August 17, 1981 from a distance of 8.9 million kilometers (5.5 million miles). In addition to the previously known blue color of the C-ring and the Cassini Division, the picture shows additional color differences between the inner B-ring and and outer region (where the spokes form) and between these and the A-ring. (Courtesy NASA/JPL)
The Saturn System This picture of the Saturnian system was prepared from an assemblage of images taken by the Voyager 1 spacecraft during its Saturn encounter in November 1980. This view shows Dione in the forefront, Saturn rising behind, Epimetheus (top-left) and Rhea just to the left of Saturn's rings. To the right and below Saturn's rings are Enceladus, Mimas, Tethys, and Iapetus (bottom-right). The cloud covered Titan is at the top-right. (Copyright Calvin J. Hamilton)
Saturn has 31 officially recognized and named satellites. In addition, there are other unconfirmed satellites. One circles in the orbit of Dione, a second is located between the orbits of Tethys and Dione, and a third is located between Dione and Rhea. The unconfirmed satellites were found in Voyager photographs, but were not confirmed by more than one sighting. Recently, the Hubble Space Telescope imaged four objects that might be new moons.
Several generalizations can be made about the satellites of Saturn. Only Titan has an appreciable atmosphere. Most of the satellites have a synchronous rotation. The exceptions are Hyperion, which has a chaotic orbit, and Phoebe. Saturn has a regular system of satellites. That is, the satellites have nearly circular orbits and lie in the equatorial plane. The two exceptions are Iapetus and Phoebe. All of the satellites have a density of < 2 gm/cm3. This indicates they are composed of 30 to 40% rock and 60 to 70% water ice. Most of the satellites reflect 60 to 90% of the light that strikes them. The outer four satellites reflect less than this and Phoebe reflects only 2% of the light that strikes it.
The following table summarizes the radius, mass, distance from the planet center, discoverer and the date of discovery of each of the confirmed satellites of Saturn:
| Moon | # | Radius (km) | Mass (kg) | Distance (km) | Discoverer | Date |
|---|---|---|---|---|---|---|
| Pan | XVIII | 9.655 | ? | 133,583 | Mark R. Showalter | 1990 |
| S/2005 S1 | 7 | ? | 136,530 | Cassini Spacecraft | 2005 | |
| Atlas | XV | 20x15 | ? | 137,640 | R. Terrile | 1980 |
| Prometheus | XVI | 72.5x42.5x32.5 | 2.7e+17* | 139,350 | S. Collins & others | 1980 |
| Pandora | XVII | 57x42x31 | 2.2e+17* | 141,700 | S. Collins & others | 1980 |
| Epimetheus | XI | 72x54x49 | 5.6e+17* | 151,422 | R. Walker | 1980 |
| Janus | X | 98x96x75 | 2.01e+18* | 151,472 | Audouin Dollfus | 1966 |
| Mimas | I | 198.6 +- 0.6 | 3.84E+19 | 185,520 | William Herschel | 1789 |
| Enceladus | II | 249.4 +- 0.2 | 8.65E+19 | 238,020 | William Herschel | 1789 |
| Tethys | III | 529.9 +- 1.5 | 6.176E+20 | 294,660 | Giovanni Domenico Cassini | 1684 |
| Telesto | XIII | 17x14x13 | ? | 294,660 | B. Smith & others | 1980 |
| Calypso | XIV | 17x11x11 | ? | 294,660 | B. Smith & others | 1980 |
| Dione | IV | 559. +- 5 | 1.0959E+21 | 377,400 | Giovanni Domenico Cassini | 1684 |
| Helene | XII | 18x16x15 | ? | 377,400 | P. Laques & J. Lecacheus | 1980 |
| Rhea | V | 764. +- 4 | 2.3166E+21 | 527,040 | Giovanni Domenico Cassini | 1672 |
| Titan | VI | 2575.5 +- 2 | 1.345426E+23 | 1,221,850 | Christiaan Huygens | 1655 |
| Hyperion | VII | 205x130x110 | 1.77E+19 | 1,481,000 | William Cranch Bond | 1848 |
| Iapetus | VIII | 730 | 1.88E+21 | 3,561,300 | Giovanni Domenico Cassini | 1671 |
| Kiviuq | XXIV | 7 | 11,365,000 | B. Gladman | 2000 | |
| Ijiraq | XXII | 5 | 11,442,000 | J.J. Kavelaars, B. Gladman | 2000 | |
| Phoebe | IX | 115 x 110 x 105 | 4E+18 | 12,952,000 | William Henry Pickering | 1898 |
| Paaliaq | XX | 9.5 | 15,198,000 | B. Gladman | 2000 | |
| Skathi | XXVII | 3.2 | 15,641,000 | J.J. Kavelaars, B. Gladman | 2000 | |
| Albiorix | XXVI | 13 | 16,394,000 | M. Holman, T.B. Spahr | 2000 | |
| Erriapo | XXVIII | 4.3 | 17,604,000 | J.J. Kavelaars, B. Gladman | 2000 | |
| Siarnaq | XXIX | 16 | 18,195,000 | B. Gladman, J.J. Kavelaars | 2000 | |
| Tarvos | XXI | 6.5 | 18,239,000 | J.J. Kavelaars, B. Gladman | 2000 | |
| S/2003 S1 | 3.3 | 18,719,000 | S.S. Sheppard | 2003 | ||
| Mundilfari | XXV | 2.8 | 18,722,000 | B. Gladman, J.J. Kavelaars | 2000 | |
| Suttungr | XXIII | 2.8 | 19,465,000 | B. Gladman, J.J. Kavelaars | 2000 | |
| Thrymr | XXX | 2.8 | 20,219,000 | B. Gladman, J.J. Kavelaars | 2000 | |
| Ymir | XIX | 8 | 23,130,000 | B. Gladman | 2000 |
Uranus
Uranus is the seventh planet from the Sun and is the third largest in the solar system. It was discovered by William Herschel in 1781. It has an equatorial diameter of 51,800 kilometers (32,190 miles) and orbits the Sun once every 84.01 Earth years. It has a mean distance from the Sun of 2.87 billion kilometers (1.78 billion miles). It rotates about its axis once every 17 hours 14 minutes. Uranus has at least 22 moons. The two largest moons, Titania and Oberon, were discovered by William Herschel in 1787.
The atmosphere of Uranus is composed of 83% hydrogen, 15% helium, 2% methane and small amounts of acetylene and other hydrocarbons. Methane in the upper atmosphere absorbs red light, giving Uranus its blue-green color. The atmosphere is arranged into clouds running at constant latitudes, similar to the orientation of the more vivid latitudinal bands seen on Jupiter and Saturn. Winds at mid-latitudes on Uranus blow in the direction of the planet's rotation. These winds blow at velocities of 40 to 160 meters per second (90 to 360 miles per hour). Radio science experiments found winds of about 100 meters per second blowing in the opposite direction at the equator.
Uranus is distinguished by the fact that it is tipped on its side. Its unusual position is thought to be the result of a collision with a planet-sized body early in the solar system's history. Voyager 2 found that one of the most striking influences of this sideways position is its effect on the tail of the magnetic field, which is itself tilted 60 degrees from the planet's axis of rotation. The magnetotail was shown to be twisted by the planet's rotation into a long corkscrew shape behind the planet. The magnetic field source is unknown; the electrically conductive, super-pressurized ocean of water and ammonia once thought to lie between the core and the atmosphere now appears to be nonexistent. The magnetic fields of Earth and other planets are believed to arise from electrical currents produced in their molten cores.
Uranus' Rings
In 1977, the first nine rings of Uranus were discovered. During the Voyager encounters, these rings were photographed and measured, as were two other new rings and ringlets. Uranus' rings are distinctly different from those at Jupiter and Saturn. The outermost epsilon ring is composed mostly of ice boulders several feet across. A very tenuous distribution of fine dust also seems to be spread throughout the ring system.There may be a large number of narrow rings, or possibly incomplete rings or ring arcs, as small as 50 meters (160 feet) in width. The individual ring particles were found to be of low reflectivity. At least one ring, the epsilon, was found to be gray in color. The moons Cordelia and Ophelia act as shepherd satellites for the epsilon ring.
| Uranus Statistics | |
|---|---|
| Discovered by | William Herschel |
| Date of discovery | 1781 |
| Mass (kg) | 8.686e+25 |
| Mass (Earth = 1) | 1.4535e+01 |
| Equatorial radius (km) | 25,559 |
| Equatorial radius (Earth = 1) | 4.0074 |
| Mean density (gm/cm^3) | 1.29 |
| Mean distance from the Sun (km) | 2,870,990,000 |
| Mean distance from the Sun (Earth = 1) | 19.1914 |
| Rotational period (hours) | -17.9 |
| Orbital period (years) | 84.01 |
| Mean orbital velocity (km/sec) | 6.81 |
| Orbital eccentricity | 0.0461 |
| Tilt of axis (degrees) | 97.86 |
| Orbital inclination (degrees) | 0.774 |
| Equatorial surface gravity (m/sec^2) | 7.77 |
| Equatorial escape velocity (km/sec) | 21.30 |
| Visual geometric albedo | 0.51 |
| Magnitude (Vo) | 5.52 |
| Mean cloud temperature | -193°C |
| Atmospheric pressure (bars) | 1.2 |
| Atmospheric composition Hydrogen Helium Methane | 83% 15% 2% |
- Historical background: Discovery of Uranus.
- Magnetic field of Uranus.
- Core & magnetic field of Uranus.
Uranus The greenish color of it atmosphere is due to methane and This view of Uranus was acquired by Voyager 2 on January 10, 1986. The blue-green appearance of its atmosphere results from methane and high-altitude photochemical smog. This gas absorbs red wavelengths from the incoming sunlight, leaving the predominant bluish color seen here. Towards the bottom of the image a few clouds can be seen. This image is one of the few Voyager pictures that shows this type of cloud. (Copyright Calvin J. Hamilton)
The Interior of Uranus Our knowledge of the internal structure of Uranus is inferred from the planet's radius, mass, period of rotation, the shape of its gravitational field and the behavior of hydrogen, helium, and water at high pressure. Its internal structure is similar to that of Neptune except for the fact that it is less active in terms of atmospheric dynamics and interior heat flow.
This cut-away view shows Uranus composed of an outer envelope of molecular hydrogen, helium and methane roughly the mass of one to two Earths. Below this region Uranus appears to be composed of a mantle rich in water, methane, ammonia, and other elements. These elements are under high temperatures and pressures deep within the planet. The mantle is equivalent to 10 to 15 earth masses. Uranus's core is composed of rock and ice, and is likely no more than one Earth mass. (Copyright Calvin J. Hamilton)
Uranus with its Rings This is the highest resolution image of Uranus with its rings ever assembled. Four separate images were mosaicked together to create the picture of Uranus. The rings were made from two high resolution images of Uranus's rings in which a strip was cut out and projected for a full 360 degrees. The rings and planet are to scale and shows the view Voyage 2 had of at the time the images were taken. The rings shown in the picture are Epsilon, Delta, Gamma, Eta, Beta, Alpha, 4, 5, and 6. Although there are other rings, these are the ones that could be seen on the Voyger 2 images at the point in time in which the pictures were taken. (Copyright Calvin J. Hamilton)
Uranus in True and False Color These two pictures of Uranus, one in true color (left) and the other in false color, were compiled from images returned January 17, 1986, by the narrow-angle camera of Voyager 2. The spacecraft was 9.1 million kilometers (5.7 million miles) from the planet, several days from closest approach. The picture at left has been processed to show Uranus as human eyes would see it from the vantage point of the spacecraft. The picture is a composite of images taken through blue, green and orange filters. The darker shadings at the upper right of the disk correspond to the day-night boundary on the planet. Beyond this boundary lies the hidden northern hemisphere of Uranus, which remains in total darkness as the planet rotates. The blue-green color results from the absorption of red light by methane gas in Uranus' deep, cold and remarkably clear atmosphere. The picture at right uses false color and extreme contrast enhancement to bring out subtle details in the polar region of Uranus. Images obtained through ultraviolet, violet and orange filters were respectively converted to the same blue, green and red colors used to produce the picture at left. The very slight contrasts visible in true color are greatly exaggerated here. In this false-color picture, Uranus reveals a dark polar hood surrounded by a series of progressively lighter concentric bands. One possible explanation is that a brownish haze or smog, concentrated over the pole, is arranged into bands by zonal motions of the upper atmosphere. The bright orange and yellow strip at the lower edge of the planet's limb is an artifact of the image enhancement. In fact, the limb is dark and uniform in color around the planet. (Courtesy NASA/JPL)
Voyager Farewell Image This view of Uranus was recorded by Voyager 2 on January 25, l986, as the spacecraft left the planet behind and set forth on its cruise to Neptune. Voyager was 1 million kilometers (620,000 miles) from Uranus when it acquired this wide-angle view. The picture has a resolution of 140 kilometers (90 miles). The thin crescent of Uranus is seen at an angle of 153 degrees between the spacecraft, the planet and the Sun. Even at this extreme angle, Uranus retains the pale blue-green color seen by ground-based astronomers and recorded by Voyager during its historic encounter. This color results from the presence of methane in Uranus' atmosphere; the gas absorbs red wavelengths of light, leaving the predominant hue seen here. The tendency for the crescent to become white at the extreme edge is caused by the presence of a high-altitude haze. (Copyright Calvin J. Hamilton)
Hubble Tracks Rotation of Uranus This view of Uranus was acquired by NASA's Hubble Space Telescope and reveals a pair of bright clouds in the planet's southern hemisphere, and a high altitude haze that forms a "cap" above the planet's south pole. This is just one view of a sequence of three that can be obtained by selecting the above gif image.
Hubble's new view was obtained on August 14, 1994, when Uranus was 2.8 billion kilometers (1.7 billion miles) from Earth. These atmospheric details were only previously seen by the Voyager 2 spacecraft, which flew by Uranus in 1986. Since then, detailed observations of Uranus's atmospheric features have not been possible because the planet is at the resolution limit of ground-based telescopes.
Hubble's Wide Field Planetary Camera 2 observed Uranus through a filter that is sensitive to light reflected by a pair of high altitude clouds. This makes a high altitude haze over Uranus' south polar region clearly visible, along with a pair of high altitude clouds or plume-type features that are 4,300 and 3,100 kilometers (2,500 and 1,800 miles) across, respectively. (Credit Kenneth Seidelmann, U.S. Naval Observatory, and NASA)
Two additional Hubble Telescope images can be found here.
Uranus Ring System This dramatic Voyager 2 picture reveals a continuous distribution of small particles throughout the Uranian ring system. The unique geometry of this picture makes the previously unseen lanes of fine dust particles visible. All the formerly known rings are visible here; however, some of the brightest features in the image are bright dust lanes not previously seen. The combination of this unique geometry and a long, 96 second exposure allowed this spectacular observation. The image was acquired through the clear filter of Voyager's wide-angle camera. The long exposure produced a noticeable, non-uniform smear as well as streaks due to trailed stars. (Copyright Calvin J. Hamilton)
Shepherd Satellites The discovery of two shepherd satellites has advanced our understanding of the structure of the Uranian rings. The moons, Cordelia (1986U7) and Ophelia (1986U8), are seen here on either side of the bright epsilon ring; all 9 of the known Uranian rings are also visible. The epsilon ring appears surrounded by a dark halo as a result of image processing; occasional blips seen on the ring are also artifacts. Lying inward from the epsilon ring are the delta, gamma and eta rings; the beta and alpha rings; and finally the barely visible 4, 5 and 6 rings. The rings have been studied since their discovery in 1977. (Courtesy NASA/JPL)
Pseudo-image of Uranus' Ring This pseudo-image of Uranus' rings was generated by using Voyager 2 frame FDS 26852.19. This image was taken in forward scattered light and shows dust bands not seen in any other image. A 3 pixel wide slice was taken from the most detailed part of the image, averaged to a 1 pixel wide image, then rotated 360 degrees and projected into perspective view. The real color of the rings are neutral gray and they are as dark as charcoal. (Courtesy A. Tayfun Oner)
Uranus' Rings The 9 known rings of Uranus are visible here. The somewhat fainter, pastel lines seen between the rings are artifacts of computer enhancement. Six narrow-angle images were used to extract color information from the extremely dark and faint rings. The final image was made from three color averages and represents an enhanced, false-color view. The image shows that the brightest, or epsilon, ring at top is neutral in color, with the fainter 8 remaining rings showing color differences between them. (Courtesy NASA/JPL)
Uranian System This montage of the Uranian system was prepared from an assemblage of images taken by the Voyager 2 spacecraft during its Uranus encounter in January 1986. This artist's view shows Ariel in the forefront, with Uranus rising behind. Traversing clockwise from Ariel are the satellites Umbriel, Oberon, Titania, Miranda, and the small moon Puck. (Copyright Calvin J. Hamilton)
The following is a summary of the rings of Uranus.
| Name | Distance* | Width | Thickness | Mass | Albedo |
|---|---|---|---|---|---|
| 1986U2R | 38,000 km | 2,500 km | 0.1 km | ? | 0.03 |
| 6 | 41,840 km | 1-3 km | 0.1 km | ? | 0.03 |
| 5 | 42,230 km | 2-3 km | 0.1 km | ? | 0.03 |
| 4 | 42,580 km | 2-3 km | 0.1 km | ? | 0.03 |
| Alpha | 44,720 km | 7-12 km | 0.1 km | ? | 0.03 |
| Beta | 45,670 km | 7-12 km | 0.1 km | ? | 0.03 |
| Eta | 47,190 km | 0-2 km | 0.1 km | ? | 0.03 |
| Gamma | 47,630 km | 1-4 km | 0.1 km | ? | 0.03 |
| Delta | 48,290 km | 3-9 km | 0.1 km | ? | 0.03 |
| 1986U1R | 50,020 km | 1-2 km | 0.1 km | ? | 0.03 |
| Epsilon | 51,140 km | 20-100 km | < 0.15 km | ? | 0.03 |
The following table summarizes the radius, mass, distance from the planet center, discoverer and the date of discovery of each of the moons of Uranus:
| Moon | # | Radius (km) | Mass (kg) | Distance (km) | Discoverer | Date |
|---|---|---|---|---|---|---|
| Cordelia | VI | 13 | ? | 49,750 | Voyager 2 | 1986 |
| Ophelia | VII | 16 | ? | 53,760 | Voyager 2 | 1986 |
| Bianca | VIII | 22 | ? | 59,160 | Voyager 2 | 1986 |
| Cressida | IX | 33 | ? | 61,770 | Voyager 2 | 1986 |
| Desdemona | X | 29 | ? | 62,660 | Voyager 2 | 1986 |
| Juliet | XI | 42 | ? | 64,360 | Voyager 2 | 1986 |
| Portia | XII | 55 | ? | 66,100 | Voyager 2 | 1986 |
| Rosalind | XIII | 27 | ? | 69,930 | Voyager 2 | 1986 |
| Belinda | XIV | 34 | ? | 75,260 | Voyager 2 | 1986 |
| 1986U10 | XVIII | 40 | ? | 75,000 | Karkoschka | 1999 |
| Puck | XV | 77 | ? | 86,010 | Voyager 2 | 1985 |
| Miranda | V | 235.8 | 6.33e+19 | 129,780 | G. Kuiper | 1948 |
| Ariel | I | 578.9 | 1.27e+21 | 191,240 | W. Lassell | 1851 |
| Umbriel | II | 584.7 | 1.27e+21 | 265,970 | W. Lassell | 1851 |
| Titania | III | 788.9 | 3.49e+21 | 435,840 | W. Herschel | 1787 |
| Oberon | IV | 761.4 | 3.03e+21 | 582,600 | W. Herschel | 1787 |
| Caliban | XVI | 49 | ? | 7,169,000 | Gladman | 1997 |
| Stephano | XX | 10 | ? | 7,948,000 | Gladman | 1999 |
| Sycorax | XVII | 95 | ? | 12,213,000 | Nicholson | 1997 |
| Prospero | XVIII | 15 | ? | 16,568,000 | Holman | 1999 |
| Setebos | XIX | 15 | ? | 17,681,000 | Kavelaars | 1999 |
Neptune
Neptune is the outermost planet of the gas giants. It has an equatorial diameter of 49,500 kilometers (30,760 miles). If Neptune were hollow, it could contain nearly 60 Earths. Neptune orbits the Sun every 165 years. It has eight moons, six of which were found by Voyager. A day on Neptune is 16 hours and 6.7 minutes. Neptune was discovered on September 23, 1846 by Johann Gottfried Galle, of the Berlin Observatory, and Louis d'Arrest, an astronomy student, through mathematical predictions made by Urbain Jean Joseph Le Verrier.
The first two thirds of Neptune is composed of a mixture of molten rock, water, liquid ammonia and methane. The outer third is a mixture of heated gases comprised of hydrogen, helium, water and methane. Methane gives Neptune its blue cloud color.
Neptune is a dynamic planet with several large, dark spots reminiscent of Jupiter's hurricane-like storms. The largest spot, known as the Great Dark Spot, is about the size of the earth and is similar to the Great Red Spot on Jupiter. Voyager revealed a small, irregularly shaped, eastward-moving cloud scooting around Neptune every 16 hours or so. This scooter as it has been dubbed could be a plume rising above a deeper cloud deck.
Long bright clouds, similar to cirrus clouds on Earth, were seen high in Neptune's atmosphere. At low northern latitudes, Voyager captured images of cloud streaks casting their shadows on cloud decks below.
The strongest winds on any planet were measured on Neptune. Most of the winds there blow westward, opposite to the rotation of the planet. Near the Great Dark Spot, winds blow up to 2,000 kilometers (1,200 miles) an hour.
Neptune has a set of four rings which are narrow and very faint. The rings are made up of dust particles thought to have been made by tiny meteorites smashing into Neptune's moons. From ground based telescopes the rings appear to be arcs but from Voyager 2 the arcs turned out to be bright spots or clumps in the ring system. The exact cause of the bright clumps is unknown.
The magnetic field of Neptune, like that of Uranus, is highly tilted at 47 degrees from the rotation axis and offset at least 0.55 radii (about 13,500 kilometers or 8,500 miles) from the physical center. Comparing the magnetic fields of the two planets, scientists think the extreme orientation may be characteristic of flows in the interior of the planet and not the result of that planet's sideways orientation or of any possible field reversals at either planet.
| Neptune Statistics | |
|---|---|
| Discovered by | Johann Gotfried Galle |
| Date of discovery | September 23, 1846 |
| Mass (kg) | 1.024e+26 |
| Mass (Earth = 1) | 1.7135e+01 |
| Equatorial radius (km) | 24,746 |
| Equatorial radius (Earth = 1) | 3.8799e+00 |
| Mean density (gm/cm^3) | 1.64 |
| Mean distance from the Sun (km) | 4,504,300,000 |
| Mean distance from the Sun (Earth = 1) | 30.0611 |
| Rotational period (hours) | 16.11 |
| Orbital period (years) | 164.79 |
| Mean orbital velocity (km/sec) | 5.45 |
| Orbital eccentricity | 0.0097 |
| Tilt of axis (degrees) | 29.56 |
| Orbital inclination (degrees) | 1.774 |
| Equatorial surface gravity (m/sec^2) | 11.0 |
| Equatorial escape velocity (km/sec) | 23.50 |
| Visual geometric albedo | 0.41 |
| Magnitude (Vo) | 7.84 |
| Mean cloud temperature | -193 to -153°C |
| Atmospheric pressure (bars) | 1-3 |
| Atmospheric composition Hydrogen Helium Methane | 85% 13% 2% |
Neptune This picture of Neptune was taken by Voyager 2 on August 20, 1989. One of the great cloud features, dubbed the Great Dark Spot by Voyager scientists, can be seen toward the center of the image. It is at a latitude of 22 degrees south and circuits Neptune every 18.3 hours. The bright clouds to the south and east of the Great Dark Spot constantly change their appearances in periods as short as four hours. (Copyright Calvin J. Hamilton)
The Interior of Neptune Our knowledge of the internal structure of Neptune is inferred from the planet's radius, mass, period of rotation, the shape of its gravitational field and the behavior of hydrogen, helium, and water at high pressure. This cut-away view shows Neptune composed of an outer envelope of molecular hydrogen, helium and methane roughly the mass of one to two Earths. Below this region Neptune appears to be composed of a mantle rich in water, methane, ammonia, and other elements. These elements are under high temperatures and pressures deep within the planet. The mantle is equivalent to 10 to 15 earth masses. Neptune's core is composed of rock and ice, and is likely no more than one Earth mass. (Copyright Calvin J. Hamilton)
HST Observes Triton and Neptune This mosaic combines an almost true-color picture of Neptune taken by the Hubble Space Telescope's (HST) Wide Field Planetary Camera (WFPC), with a picture of Triton taken with the HST's Faint Object Camera. Although faint, the image of Triton vaguely shows a brighter equatorial region. The south pole is to the lower left.
The picture of Neptune shows a bright cloud feature at the south pole, near the bottom of the image. Bright cloud bands can be seen at 30S and 60S latitude. The northern hemisphere also includes a bright cloud band centered near 30� N latitude. (Courtesy of Ted Stryk)
HST Observations of Neptune These almost true-color pictures of Neptune were constructed from HST/WFPC2 images taken in blue (467-nm), green (588-nm), and red (673-nm) spectral filters. There is a bright cloud feature at the south pole, near the bottom right of the image. Bright cloud bands can be seen at 30S and 60S latitude. The northern hemisphere also includes a bright cloud band centered near 30° N latitude. The second picture was compiled from images taken after the planet had rotated about 180 degrees of longitude (about 9 hours later) to show the opposite hemisphere.
One feature that is conspicuous by its absence is the storm system known as the Great Dark Spot. The second smaller dark spot, DS2, that was seen during the Voyager-2 encounter was also missing. The absence of these dark spots was one of the biggest surprises of this program. These dramatic changes in the large-scale storm systems and planet-encircling clouds bands on Neptune are not yet completely understood, but they emphasize the dynamic nature of this planet's atmosphere, and the need for further monitoring.
HST Observes High Altitude Clouds These three images were taken on October 10, October 18 and November 2, 1994, when Neptune was 4.5 billion kilometers from Earth. Building on Voyager's initial discoveries, Hubble has revealed that Neptune has a remarkably dynamic atmosphere that changes over just a few days. The temperature difference between Neptune's strong internal heat source and its frigid cloud tops (-162° Celcius or -260° Fahrenheit) might trigger instabilities in the atmosphere that drive these large-scale weather changes. The pink features are high-altitude methane ice crystal clouds.
HST Finds New Dark Spot In June 1994, the Hubble telescope revealed that the Great Dark Spot found by Voyager 2 was missing. This new image taken on November 2, shows that a new spot near the limb of the planet has formed. Like its predecessor, the new spot has high altitude clouds along its edge, caused by gasses that have been pushed to higher altitudes where they cool to form methane ice crystal clouds. The dark spot may be a zone of clear gas that is a window to a cloud deck lower in the atmosphere.
Cirrus-like Clouds This image shows bands of sunlit cirrus-like clouds in Neptune's northern hemisphere. These clouds cast shadows on the blue cloud deck 35 miles below. The white streaky clouds are from 48 to 160 kilometers (30 to 100 miles) wide and extend for thousands of miles. (Copyright Calvin J. Hamilton)
True-color Image This Voyager 2 image has been processed by computers so that both the clouds' structure in the dark regions near the pole and the bright clouds east of the Great Dark Spot are visible. Small trails of clouds trending east to west and large-scale structure east of the Great Dark Spot all suggest that waves are present in the atmosphere and play a large role in the type of clouds that are visible. (Courtesy NASA/JPL)
Great Dark Spot Feathery white clouds fill the boundary between the dark and light blue regions on the Great Dark Spot. The pinwheel shape of both the dark boundary and the white cirrus suggests that the storm system rotates counterclockwise. Periodic small scale patterns in the white cloud, possibly waves, are short lived and do not persist from one Neptunian rotation to the next. (Courtesy NASA/JPL)
Change In The Great Dark Spot The bright cirrus-like clouds of Neptune change rapidly, often forming and dissipating over periods of several to tens of hours. In this sequence spanning two rotations of Neptune (about 36 hours) Voyager 2 observed cloud evolution in the region around the Great Dark Spot at an effective resolution of about 100 kilometers (62 miles) per pixel. The surprisingly rapid changes which occur over the 18 hours separating each panel shows that in this region Neptune's weather is perhaps as dynamic and variable as that of the Earth. However, the scale is immense by our standards. The Earth and the Great Dark Spot are of similar size and in Neptune's frigid atmosphere, where temperatures are as low as 55 degrees Kelvin (-360 F), the cirrus clouds are composed of frozen methane rather than Earth's crystals of water ice. (Courtesy NASA/JPL)
High Resolution Crescent Image of Neptune This high resolution crescent image of Neptune was taken by the Voyager 2 spacecraft on on August 31, 1989. A circular storm pattern can be seen on the limb of the planet. (Copyright 2001 by Calvin J. Hamilton)
Parting Look This Voyager 2 image shows a beautiful dual-crescent view of Neptune and Triton. The image, acquired on August 31, 1989, is a parting tribute of the Voyager mission. (Copyright Calvin J. Hamilton)
Small Dark Spot This image shows the Small Dark Spot, which is south of the Great Dark Spot. The small spot is thought to be a storm in Neptune's atmosphere, perhaps similar to Jupiter's Great Red Spot. (Copyright Calvin J. Hamilton)
Neptune Rings These two 591-second exposures of the rings of Neptune were taken by Voyager 2 on August 26, 1989 from a distance of 280,000 kilometers (174,000 miles). The two main rings are clearly visible and appear complete over the region imaged. Also visible in this image is the inner faint ring at about 42,000 kilometers (25,000 miles) from the center of Neptune, and the faint band which extends smoothly from the 53,000 kilometer (33,000 miles) ring to roughly halfway between the two bright rings. The bright glare in the center is due to over-exposure of the crescent of Neptune. Numerous bright stars are evident in the background. Both rings are continuous. (Courtesy NASA/JPL)
Twisted Rings This portion of one of Neptune's rings appears to be twisted. Scientists believe it looks this way because the original material in the rings was in clumps that formed streaks as the material orbited Neptune. The motion of the spacecraft added to the twisted appearance by causing a slight smearing in the image. (Courtesy NASA/JPL)
The following table is a summary of the rings of Neptune.
| Name | Distance* | Width | Thickness | Mass | Albedo |
|---|---|---|---|---|---|
| 1989N3R | 41,900 km | 15 km | ? | ? | low |
| 1989N2R | 53,200 km | 15 km | ? | ? | low |
| 1989N4R | 53,200 km | 5,800 km | ? | ? | low |
| 1989N1R | 62,930 km | < 50 km | ? | ? | low |
The following table summarizes the radius, mass, distance from the planet center, discoverer and the date of discovery of each of the moons of Neptune:
| Moon | # | Radius (km) | Mass (kg) | Distance (km) | Discoverer | Date |
|---|---|---|---|---|---|---|
| Naiad | III | 29 | ? | 48,000 | Voyager 2 | 1989 |
| Thalassa | IV | 40 | ? | 50,000 | Voyager 2 | 1989 |
| Despina | V | 74 | ? | 52,500 | Voyager 2 | 1989 |
| Galatea | VI | 79 | ? | 62,000 | Voyager 2 | 1989 |
| Larissa | VII | 104x89 | ? | 73,600 | Voyager 2 | 1989 |
| Proteus | VIII | 200 | ? | 117,600 | Voyager 2 | 1989 |
| Triton | I | 1,350 | 2.14e+22 | 354,800 | W. Lassell | 1846 |
| Nereid | II | 170 | ? | 5,513,400 | G. Kuiper | 1949 |
Dwarf Planet Pluto
Although Pluto was discovered in 1930, limited information on the distant object delayed a realistic understanding of its characteristics. Pluto is the second largest known dwarf planet and tenth largest orbiting the Sun. From its time of discovery in 1930 to 2006 it was considered to be the ninth planet in the solar system, but because additional objects have been discovered including Eris which is 27% more massive, the IAU reclassified Pluto and the other objects as dwarf planets. The New Horizons spacecraft was launched on January 16, 2006 and will make its closest approach to Pluto on July 14, 2015. This mission will provide an increased amount of information about this peculiar dwarf planet. The uniqueness of Pluto's orbit, rotational relationship with its satellite, spin axis, and light variations all give it a certain appeal.
Pluto is usually farther from the Sun than any of the eight planets; however, due to the eccentricity of its orbit, it is closer than Neptune for 20 years out of its 249 year orbit. Pluto crossed Neptune's orbit January 21, 1979, made its closest approach September 5, 1989, and remained within the orbit of Neptune until February 11, 1999. This will not occur again until September 2226.
As Pluto approaches perihelion it reaches its maximum distance from the ecliptic due to its 17-degree inclination. Thus, it is far above or below the plane of Neptune's orbit. Under these conditions, Pluto and Neptune will not collide and do not approach closer than 18 A.U. to one another.
Pluto's rotation period is 6.387 days, the same as its satellite Charon. Although it is common for a satellite to travel in a synchronous orbit with its planet, Pluto rotates synchronously with the orbit of its satellite. Thus being tidally locked, Pluto and Charon continuously face each other as they travel through space.
Unlike most planets, but similar to Uranus, Pluto rotates with its poles almost in its orbital plane. Pluto's rotational axis is tipped 122 degrees. When Pluto was first discovered, its relatively bright south polar region was the view seen from the Earth. Pluto appeared to grow dim as our viewpoint gradually shifted from nearly pole-on in 1954 to nearly equator-on in 1973. Pluto's equator is now the view seen from Earth.
During the period from 1985 through 1990, Earth was aligned with the orbit of Charon around Pluto such that an eclipse could be observed every Pluto day. This provided opportunity to collect significant data which led to albedo maps defining surface reflectivity, and to the first accurate determination of the sizes of Pluto and Charon, including all the numbers that could be calculated therefrom.
The first eclipses (mutual events) began blocking the north polar region. Later eclipses blocked the equatorial region, and final eclipses blocked Pluto's south polar region. By carefully measuring the brightness over time, it was possible to determine surface features. It was found that Pluto has a highly reflective south polar cap, a dimmer north polar cap, and both bright and dark features in the equatorial region. Pluto's geometric albedo is 0.49 to 0.66, which is much brighter than Charon. Charon's albedo ranges from 0.36 to 0.39.
The eclipses lasted as much as four hours and by carefully timing their beginning and ending, measurements for their diameters were taken. The diameters can also be measured directly to within about 1 percent by more recent images provided by the Hubble Space Telescope. These images resolve the objects to clearly show two separate disks. The improved optics allow us to measure Pluto's diameter as 2,274 kilometers (1413 miles) and Charon's diameter as 1,172 kilometers (728 miles), just over half the size of Pluto. Their average separation is 19,640 km (12,200 miles). That's roughly eight Pluto diameters.
Average separation and orbital period are used to calculate Pluto and Charon's masses. Pluto's mass is about 6.4 x 10⁻⁹ solar masses. This is close to 7 (was 12 x's) times the mass of Charon and approximately 0.0021 Earth mass, or a fifth of our moon.
Pluto's average density lies between 1.8 and 2.1 grams per cubic centimeter. It is concluded that Pluto is 50% to 75% rock mixed with ices. Charon's density is 1.2 to 1.3 g/cm3, indicating it contains little rock. The differences in density tell us that Pluto and Charon formed independently, although Charon's numbers derived from HST data are still being challenged by ground based observations. Pluto and Charon's origin remains in the realm of theory.
Pluto's icy surface is 98% nitrogen (N2). Methane (CH4) and traces of carbon monoxide (CO) are also present. The solid methane indicates that Pluto is colder than 70 Kelvin. Pluto's temperature varies widely during the course of its orbit since Pluto can be as close to the sun as 30 AU and as far away as 50 AU. There is a thin atmosphere that freezes and falls to the surface as the planet moves away from the Sun. The atmospheric pressure deduced for Pluto's surface is 1/100,000 that of Earth's surface pressure.
Pluto was officially labeled the ninth planet by the International Astronomical Union in 1930 and named for the Roman god of the underworld. It was the first and only planet to be discovered by an American, Clyde W. Tombaugh. It has since been reclassified as a Dwarf Planet along with Eris and Ceres.
The path toward its discovery is credited to Percival Lowell who founded the Lowell Observatory in Flagstaff, Arizona and funded three separate searches for "Planet X." Lowell made numerous unsuccessful calculations to find it, believing it could be detected from the effect it would have on Neptune's orbit. Dr. Vesto Slipher, the observatory director, hired Clyde Tombaugh for the third search and Clyde took sets of photographs of the plane of the solar system (ecliptic) one to two weeks apart and looked for anything that shifted against the backdrop of stars. This systematic approach was successful and Pluto was discovered by this young (born 4 Feb 1906) 24 year old Kansas lab assistant on February 18, 1930. Pluto is actually too small to be the "Planet X" Percival Lowell had hoped to find. Pluto's was a serendipitous discovery.
| Pluto Statistics | |
|---|---|
| Discovered by | Clyde W. Tombaugh |
| Date of discovery | February 18, 1930 |
| Mass (kg) | 1.27e+22 |
| Mass (Earth = 1) | 2.125e-03 |
| Equatorial radius (km) | 1,137 |
| Equatorial radius (Earth = 1) | 0.1783 |
| Mean density (gm/cm^3) | 2.05 |
| Mean distance from the Sun (km) | 5,913,520,000 |
| Mean distance from the Sun (Earth = 1)) | 39.5294 |
| Rotational period (days) | -6.3872 |
| Orbital period (years) | 248.54 |
| Mean orbital velocity (km/sec) | 4.74 |
| Orbital eccentricity | 0.2482 |
| Tilt of axis (degrees) | 122.52 |
| Orbital inclination (degrees) | 17.148 |
| Equatorial surface gravity (m/sec^2) | 0.4 |
| Equatorial escape velocity (km/sec) | 1.22 |
| Visual geometric albedo | 0.3 |
| Magnitude (Vo) | 15.12 |
| Atmospheric composition Methane Nitrogen | 0.3 |
- Pluto, Charon, and USA Size Comparison.
- Pluto rotation movie.
- Pluto rotation movie.
- Charon rotation movie.
Pluto & Charon This view of Pluto was taken by the Hubble Space Telescope. It shows a rare image of tiny Pluto with its moon Charon, which is slightly smaller than the planet. Because Pluto has not yet been visited by any spacecraft, it remains a mysterious planet. Due to its great distance from the sun, Pluto's surface is believed to reach temperatures as low as -240°C (-400°F). From Pluto's surface, the Sun appears as only a very bright star. (Courtesy NASA)
Dwarf Planets The following images represent the three newly designated dwarf planets. The image of Pluto was rendered from a map created from a servies of Hubble images. Eris is an artistic image, and Ceres is a Hubble telescope image.
(Copyright Calvin J. Hamilton)
Hubble Telescope Image This is the clearest view yet of the distant planet Pluto and its moon, Charon, as revealed by the Hubble Space Telescope (HST). The image was taken on February 21, 1994, when the planet was 4.4 billion kilometers (2.7 billion miles) from the Earth.
The HST corrected optics show the two objects as clearly separate and sharp disks. This now allows astronomers to measure directly (to within about 1 percent) Pluto's diameter of 2,320 kilometers (1,440 miles) and Charon's diameter of 1,270 kilometers (790 miles).
The HST observations show that Charon is bluer than Pluto. This means that the worlds have different surface composition and structure. A bright highlight on Pluto indicates that it might have a smoothly reflecting surface layer. A detailed analysis of the HST image also suggests that there is a bright area parallel to the equator of Pluto. However, subsequent observations are needed to confirm that this feature is real. The new HST image was taken when Charon was near its maximum elongation from Pluto (0.9 arcseconds). The two worlds are 19,640 kilometers (12,200 miles) apart. (Courtesy NASA/ESA/ESO)
The Surface of Pluto The never-before-seen surface of the distant planet Pluto is resolved in these NASA Hubble Space Telescope pictures. These images, which were made in blue light, show that Pluto is an unusually complex object, with more large-scale contrast than any planet, except Earth. Pluto probably shows even more contrast and perhaps sharper boundaries between light and dark areas than is shown here, but Hubble's resolution (just like early telescopic views of Mars) tends to blur edges and blend together small features sitting inside larger ones.
The two smaller inset pictures at the top are actual images from Hubble. North is up. Each square pixel (picture element) is more than 100 miles across. At this resolution, Hubble discerns roughly 12 major "regions" where the surface is either bright or dark. The larger images (bottom) are from a global map constructed through computer image processing performed on the Hubble data. Opposite hemispheres of Pluto are seen in these two views. (Courtesy NASA/ESA/ESO)
Pluto, Charon, and USA Comparison This image shows the approximate size of Pluto and Charon by overlaying them on an Advanced Very High Resolution Radiometer (AVHRR) image of the United States of America. Pluto is about 2274 kilometers (1410 miles) in diameter and Charon 1172 kilometers (727 miles) in diameter. The image of Pluto is based upon Hubble observations taken of Pluto in June and July of 1994. The Charon image is based upon photometric measurements acquired by Marc Buie of Lowell Observatory. (Copyright 1998 by Calvin J. Hamilton)
Map of the Surface of Pluto This is the first image-based surface map of the solar system's most remote planet, Pluto. The map, which covers 85% of the planet's surface, confirms that Pluto has a dark equatorial belt and bright polar caps, as inferred from ground-based light curves obtained during the mutual eclipses that occurred between Pluto and its satellite Charon in the late 1980s.
The brightness variations in this map may be due to topographic features such as basins and fresh impact craters. However, most of the surface features are likely produced by the complex distribution of frosts that migrate across Pluto's surface with its orbital and seasonal cycles and chemical byproducts deposited out of Pluto's nitrogen-methane atmosphere. Names may later be proposed for some of the larger regions.
Image reconstruction techniques smooth out the coarse pixels in the four raw images to reveal major regions where the surface is either bright or dark. The black strip across the bottom corresponds to the region surrounding Pluto's south pole, which was pointed away from Earth when the observations were made, and could not be imaged. (Courtesy NASA/ESA/ESO)
Ground vs. Hubble Comparison This image shows a comparison between a ground based view (left) and a Hubble Space Telescope view (right) of Pluto and Charon.
Nordic Optical Telescope This image of Pluto was taken with the 2.6 meter Nordic Optical Telescope, located at La Palma, Canary Islands. It is a good example of the best imagery that can be obtained from Earth-based telescopes. (© Copyright Nordic Optical Telescope Scientific Association -- NOTSA)
New Horizons: Pluto/Charon Mission Artist's concept of the New Horizons spacecraft during its planned encounter with Pluto and its moon, Charon. The craft's miniature cameras, radio science experiment, ultraviolet and infrared spectrometers and space plasma experiments would characterize the global geology and geomorphology of Pluto and Charon, map their surface compositions and temperatures, and examine Pluto's atmosphere in detail. The spacecraft's most prominent design feature is a nearly 7-foot (2.1-meter) dish antenna, through which it would communicate with Earth from as far as 4.7 billion miles (7.5 billion kilometers) away. (Courtesy NASA/JHUAPL/SwRI)
Asteroid
Asteroids are rocky and metallic objects that orbit the Sun but are too small to be considered planets. They are known as minor planets. Asteroids range in size from Ceres, which has a diameter of about 1000 km, down to the size of pebbles. Sixteen asteroids have a diameter of 240 km or greater. They have been found inside Earth's orbit to beyond Saturn's orbit. Most, however, are contained within a main belt that exists between the orbits of Mars and Jupiter. Some have orbits that cross Earth's path and some have even hit the Earth in times past. One of the best preserved examples is Barringer Meteor Crater near Winslow, Arizona.
 |
|---|
Much of our understanding about asteroids comes from examining pieces of space debris that fall to the surface of Earth. Asteroids that are on a collision course with Earth are called meteoroids. When a meteoroid strikes our atmosphere at high velocity, friction causes this chunk of space matter to incinerate in a streak of light known as a meteor. If the meteoroid does not burn up completely, what's left strikes Earth's surface and is called a meteorite.
Of all the meteorites examined, 92.8 percent are composed of silicate (stone), and 5.7 percent are composed of iron and nickel; the rest are a mixture of the three materials. Stony meteorites are the hardest to identify since they look very much like terrestrial rocks.
Because asteroids are material from the very early solar system, scientists are interested in their composition. Spacecraft that have flown through the asteroid belt have found that the belt is really quite empty and that asteroids are separated by very large distances. Before 1991 the only information obtained on asteroids was though Earth based observations. Then on October 1991 asteroid 951 Gaspra was visited by the Galileo spacecraft and became the first asteroid to have hi-resolution images taken of it. Again on August 1993 Galileo made a close encounter with asteroid 243 Ida. This was the second asteroid to be visited by spacecraft. Both Gaspra and Ida are classified as S-type asteroids composed of metal-rich silicates.
On June 27, 1997 the spacecraft NEAR made a high-speed close encounter with asteroid 253 Mathilde. This encounter gave scientists the first close-up look of a carbon rich C-type asteroid. This visit was unique because NEAR was not designed for flyby encounters. NEAR is an orbiter destined for asteroid Eros in January of 1999.
Astronomers have studied a number of asteroids through Earth-based observations. Several notable asteroids are Toutatis, Castalia, Geographos and Vesta. Astronomers studied Toutatis, Geographos and Castalia using Earth-based radar observations during close approaches to the Earth. Vesta was observed by the Hubble Space Telescope.
Asteroid Summary
| Num | Name | Radius (km) | Distance* (10^6km) | Albedo | Discoverer | Date |
|---|---|---|---|---|---|---|
| 1 | Ceres | 466 | 413.9 | 0.10 | G. Piazzi | 1801 |
| 511 | Davida | 168 | 475.4 | 0.05 | R. Dugan | 1903 |
| 433 | Eros | 17.5 x 6.5 | 218 | ? | G. Witt, A. Charlois | 1893 |
| 15 | Eunomia | 136 | 395.5 | 0.19 | De Gasparis | 1851 |
| 52 | Europa | 156 | 463.3 | 0.06 | Goldschmidt | 1858 |
| 951 | Gaspra | 17x10 | 330.0 | 0.20 | Neujmin | 1916 |
| 10 | Hygiea | 215 | 470.3 | 0.08 | De Gasparis | 1849 |
| 243 | Ida | 58x23 | 428 | ? | J. Palisa | 29 Sep 1884 |
| 704 | Interamnia | 167 | 458.1 | 0.06 | V. Cerulli | 1910 |
| 253 | Mathilde | 28.5 x 25 | 396 | 0.03 | J. Palisa | 1885 |
| 2 | Pallas | 261 | 414.5 | 0.14 | H. Olbers | 1802 |
| 16 | Psyche | 132 | 437.1 | 0.10 | De Gasparis | 1852 |
| 87 | Sylvia | 136 | 521.5 | 0.04 | N. Pogson | 1866 |
| 4 | Vesta | 262.5 | 353.4 | 0.38 | H. Olbers | 1807 |
Comet
Comets are small, fragile, irregularly shaped bodies composed of a mixture of non-volatile grains and frozen gases. They have highly elliptical orbits that bring them very close to the Sun and swing them deeply into space, often beyond the orbit of Pluto.
Comet structures are diverse and very dynamic, but they all develop a surrounding cloud of diffuse material, called a coma, that usually grows in size and brightness as the comet approaches the Sun. Usually a small, bright nucleus (less than 10 km in diameter) is visible in the middle of the coma. The coma and the nucleus together constitute the head of the comet.
 |
|---|
When the nucleus is frozen, it can be seen only by reflected sunlight. However, when a coma develops, dust reflects still more sunlight, and gas in the coma absorbs ultraviolet radiation and begins to fluoresce. At about 5 AU from the Sun, fluorescence usually becomes more intense than reflected light.
As the comet absorbs ultraviolet light, chemical processes release hydrogen, which escapes the comet's gravity, and forms a hydrogen envelope. This envelope cannot be seen from Earth because its light is absorbed by our atmosphere, but it has been detected by spacecraft.
The Sun's radiation pressure and solar wind accelerate materials away from the comet's head at differing velocities according to the size and mass of the materials. Thus, relatively massive dust tails are accelerated slowly and tend to be curved. The ion tail is much less massive, and is accelerated so greatly that it appears as a nearly straight line extending away from the comet opposite the Sun. The following view of Comet West shows two distinct tails. The thin blue plasma tail is made up of gases and the broad white tail is made up of microscopic dust particles.
Comet West
Comet Neat This image of comet C/2001 Q4 (NEAT) was taken at the WIYN 0.9-meter telescope at Kitt Peak National Observatory near Tucson, Arizona, on May 7, 2004.
The image was captured with the Mosaic I camera, which has a one-square degree field of view, or about five times the size of the Moon. Even with this large field, only the comet's coma and the inner portion of its tail are visible. A small star cluster (C0736-105, or Melotte 72) is visible in the lower right of the image, between the head of the comet and the bright red star in the lower-right corner. (Courtesy NASA, NOAO, NSF, STScI)
Comet Kohoutek This color photograph of the comet Kohoutek was taken by members of the lunar and planetary laboratory photographic team from the University of Arizona. They photographed the comet from the Catalina observatory with a 35mm camera on January 11, 1974. (Courtesy NASA)
Comet Hyakutake These Hubble Space Telescope images of comet Hyakutake were taken on March 25, 1996 when the comet passed at a distance of 9.3 million miles from Earth. These images focus on a very small region near the heart of the comet, the icy, solid nucleus and provide an exceptionally clear view of the near-nucleus region of the comet.
The left image is 2070 miles across (3340 km) and shows that most of the dust is being produced on the sunward-facing hemisphere of the comet. Also at upper left are three small pieces which have broken off the comet and are forming their own tails. Icy regions on the nucleus are activated as they rotate into sunlight, ejecting large amounts of dust in the jets that are faintly visible in this image. Sunlight striking this dust eventually turns it around and "blows" it into the tailward hemisphere.
The bottom-right image is an expanded view of the near-nucleus region and is only 470 miles (760 km) across. The nucleus is near the center of the frame, but the brightest area is probably the tip of the strongest dust jet rather than the nucleus itself. Presumably, the nucleus surface lies just below this bright jet. The top-right image shows pieces of the nucleus that apparently broke off. The image shows at least three separate objects that are probably made up of coarse-grained dust. Large fragments of the nucleus would not be accelerated into the tail, which appears to be the case in this image. (Credit: H. A. Weaver--Applied Research Corp., HST Comet Hyakutake Observing Team, and NASA)
First X-Rays From Comet Hyakutake Discovered This image shows the discovery of a strong X-ray radiation signal coming from comet Hyakutake. The image was made on March 27, 1996 using Germany's orbiting ROSAT satellite. The comet was near its closest approach to the Earth at a distance of less than 10 million miles when X-ray emmisions were first detected by ROSAT. The strength and rapid changes in intensity of the comet's X-ray emission both surprised and puzzled astronomers. "We had no clear expectation that comets shine in X-rays," said Dr. Michael J. Mumma of NASA's Goddard Space Flight Center, Greenbelt, MD. X-rays have never been found from a comet before, and scientists had optimistically predicted an intensity that turned out to be about 100 times weaker than the radiation actually detected by ROSAT. Strong changes in the brightness of the X-rays were another surprise. There were pronounced increases and decreases in the X-ray brightness from one ROSAT observation to another, typically over a time difference of a few hours.
Still another puzzle is the nature of the physical process that generates the X-rays, but the ROSAT image may contain clues to this process. In the image, the X-rays from the comet seem to come from a crescent-shaped region on the sunward side of Comet Hyakutake. One preliminary theory is that X-ray emission from the Sun was absorbed by a cloud of gaseous water molecules surrounding the nucleus of the comet, and then were re-emitted by the molecules in a process physicists call "fluorescence." According to this idea, the cloud is so thick that its sunward side absorbs nearly all the incoming solar X-rays, so that none reach the remainder of the cloud. This could explain why the cometary X-ray emission has the form of a crescent, rather than that of a sphere around the nucleus. A second possible explanation is that the X-rays are produced from the violent collision between the comet material and the supersonic "wind" of plasma and particles streaming away from the Sun.
Comet 1993a Mueller This is a CCD image of comet 1993a Mueller, taken on October 6, 1993 with a 288mm f/5.2 Schmidt-Cassegrain telescope. The comet has a coma diameter of 3' and a fan-shaped tail, up to 7' long. (Courtesy Erich Meyer and Herbert Raab, Austria)
Comet West (1975) This photograph was taken by amateur astronomer John Loborde on March 9, 1976. This picture shows two distinct tails. The thin blue plasma tail is made up of gases and the broad white tail is made up of microscopic dust particles. (Courtesy John Laborde)
Comet West (1975) This image of comet West was taken by John Laborde at the Tierra Del Sol Observatory site in San Diego County. The exposure was 30 minutes with a 135 mm Nikon lens. (Courtesy John Laborde)
Comet Hale-Bopp These NASA Hubble Space Telescope pictures of comet Hale-Bopp show a remarkable "pinwheel" pattern and a blob of free-flying debris near the nucleus. The bright clump of light along the spiral (above the nucleus, which is near the center of the frame) may be a piece of the comet's icy crust that was ejected into space by a combination of ice evaporation and the comet's rotation, and which then disintegrated into a bright cloud of particles.
Although the "blob" is about 3.5 times fainter than the brightest portion at the nucleus, the lump appears brighter because it covers a larger area. The debris follows a spiral pattern outward because the solid nucleus is rotating like a lawn sprinkler, completing a single rotation about once per week.
Comet Hale-Bopp This image of comet Hale-Bopp was taken by John Laborde with his home designed and built, 8.8" f/3.7 Wright Schmidt Camera. The picture was taken at the Tierra Del Sol Observatory site in San Diego County with a 25 minute exposure on Kodak PPF400 film. (Courtesy John Laborde)
Comet Ikeya-Seki This image of comet Ikeya-Seki was taken by John Laborde in Poway, California just before dawn. The exposure was 15 minutes with a 55 mm Nikon lens. (Courtesy John Laborde)
Meteoroids and Meteorites
The term meteor comes from the Greek meteoron, meaning phenomenon in the sky. It is used to describe the streak of light produced as matter in the solar system falls into Earth's atmosphere creating temporary incandescence resulting from atmospheric friction. This typically occurs at heights of 80 to 110 kilometers (50 to 68 miles) above Earth's surface. The term is also used loosely with the word meteroid referring to the particle itself without relation to the phenomena it produces when entering the Earth's atmosphere. A meteoroid is matter revolving around the sun or any object in interplanetary space that is too small to be called an asteroid or a comet. Even smaller particles are called micrometeoroids or cosmic dust grains, which includes any interstellar material that should happen to enter our solar system. A meteorite is a meteoroid that reaches the surface of the Earth without being completely vaporized.
One of the primary goals of studying meteorites is to determine the history and origin of their parent bodies. Several achondrites sampled from Antarctica since 1981 have conclusively been shown to have originated from the moon based on compositional matches of lunar rocks obtained by the Apollo missions of 1969-1972. Sources of other specific metorites remain unproven, although another set of eight achondrites are suspected to have come from Mars. These meteorites contain atmospheric gases trapped in shock melted minerals which match the composition of the Martian atmosphere as measured by the Viking landers in 1976. All other groups are presumed to have originated on asteroids or comets; the majority of meteorites are believed to be fragments of asteroids.
| Meteorite Types & Percentage that Falls to the Earth | |
|---|---|
|
|
Other meteorite types which have been geologically processed are achondrites, irons and pallasites. Achondrites are also stony meteorites, but they are considered differentiated or reprocessed matter. They are formed by melting and recrystallization on or within meteorite parent bodies; as a result, achondrites have distinct textures and mineralogies indicative of igneous processes. Pallasites are stony iron meteorites composed of olivine enclosed in metal. Iron meteorites are classified into thirteen major groups and consist primarily of iron-nickel alloys with minor amounts of carbon, sulfur, and phosphorus. These meteorites formed when molten metal segregated from less dense silicate material and cooled, showing another type of melting behavior within meteorite parent bodies. Thus, meteoritescontain evidence of changes that occurred on the parent bodies from which they were removed or broken off, presumably by impacts, to be placed in the first of many revolutions.
The motion of meteoroids can be severely perturbed by the gravitational fields of major planets. Jupiter's gravitational influence is capable of reshaping an asteroid's orbit from the main belt so that it dives into the inner solar system and crosses the orbit of Earth. This is apparently the case of the Apollo and Vesta asteroid fragments.
Particles found in highly correlated orbits are called a stream components and those found in random orbits are called sporadic components. It is thought that most meteor streams are formed by the decay of a comet nucleus and consequently are spread around the original orbit of the comet. When Earth's orbit intersects a meteor stream, the meteor rate is increased and a meteor shower results. A meteor shower typically will be active for several days. A particularly intense meteor shower is called a meteor storm. Sporadic meteors are believed to have had a gradual loss of orbital coherence with a meteor shower due to collisions and radiative effects, further enhanced by gravitational influences. There is still some debate concerning sporadic meteors and their relationship with showers.
Martian Meteorite This meteorite, a basalt lava rock nearly indistinguishable from many Earth rocks, provided the first strong proof that meteorites could come from Mars. Originally weighing nearly 8 kilograms (17.6 pounds), it was collected in 1979 in the Elephant Moraine area of Antarctica. The side of the cube at the lower left in this image measures 1 centimeter (0.4 inches).
This picture shows a sawn face of this fine-grained gray rock. (The vertical stripes are saw marks.) The black patches in the rock are melted rock, or glass, formed when a large meteorite hit Mars near the rock. The meteorite impact probably threw this rock, dubbed "EETA79001," off Mars and toward Antarctica on Earth. The black glass contains traces of martian atmosphere gases. This meteorite is 180 million years old.
The Mars Exploration Rover Opportunity has discovered that a rock dubbed "Bounce" at Meridiani Planum has a very similar mineral composition to this meteorite and likely shares common origins. Bounce itself is thought to have originated outside the area surrounding Opportunity's landing site; an impact or collision likely threw the rock away from its primary home.(Courtesy NASA/JSC/JPL)
'Block Island' Meteorite on Mars Composition measurements by NASA's Mars Exploration Rover Opportunity confirm that this rock on the Martian surface is an iron-nickel meteorite.
This image combines exposures from the left eye and right eye of the rover's panoramic camera to provide a three-dimensional view when seen through red-green glasses with the red lens on the left. The camera took the component images during the 1,961st Martian day, or sol, of Opportunity's mission on Mars (July 31), after approaching close enough to touch the rock with tools on the rover's robotic arm.
Researchers have informally named the rock "Block Island." With a width of about two-thirds of a meter (2 feet), it is the largest meteorite yet found on Mars. Opportunity found a smaller iron-nickel meteorite, called "Heat Shield Rock" in late 2004. (Courtesy NASA/JPL-Caltech/Cornell University)
Magnified Look at a Meteorite on Mars NASA's Mars Exploration Rover Opportunity used its microscopic imager to get this view of the surface of a rock called "Block Island" during the 1,963rd Martian day, or sol, of the rover's mission on Mars (Aug. 1, 2009). The triangular pattern of small ridges seen at the upper right in this image and elsewhere on the rock is characteristic of iron-nickel meteorites found on Earth, especially after they have been cut, polished and etched. Block Island has been identified as an iron-nickel meteorite based on this surface texture and analysis of its composition by Opportunity's alpha particle X-ray spectrometer. At about 60 centimeters (2 feet) across, it is the largest meteorite yet found on Mars.
This image shows a patch 32 millimeters by 32 millimeters (1.3 inches by 1.3 inches) on the surface of Block Island while the target was fully illuminated by the sun. This target on the rock is informally named "New Shoreham." The vertical white streaks, especially near the top and bottom of the image, are artifacts caused by saturation of the camera's CCD (charge-coupled device, or image recorder) where sunlight glinted off metallic facets.
The triangular pattern in the texture of iron-nickel meteorites, called the Widmanstatten pattern, formed more than 4.5 billion years ago as the metal cooled. One iron-nickel mineral, kamacite, formed thin layers along the surface of crystals of another, taenite, which contains less nickel. The two minerals differ in their resistance to either etching by acid or erosion by wind-blown sand, so those processes can make the pattern visible. (Courtesy NASA/JPL-Caltech/Cornell University/USGS)
Chondrite Meteorite This meteorite fell in 1970 in Cherokee County, Oklahoma. It is subclassed as H Group or an olivine-bronzite chondrite. Meteorites are bits of rock that are captured by a planet's gravity and pulled to the surface. This meteorite is of a type named chondrite and is thought to have formed at the same time as the planets in the solar nebula, about 4.55 billion years ago. (Copyright Calvin J. Hamilton)
Chondrite Meteorite Slice This is a section from a stone chondrite meteorite that fell in 1852 in Harghita, Romania. (Copyright Calvin J. Hamilton)
Chondrite Meteorite Showing Regmaglypts This meteorite fell in 1924. Notice the depreessions on this sample. These are called regmaglypts and are most likely paralled to the air flow direction during the flight of the meteorite. (Copyright Calvin J. Hamilton)
Achondrite Meteorite Discovered at Norton County, Kansas, this type of meteorite is known as an achondrite. It has a basaltic composition and was probably formed when an asteroid melted about 4.5 billion years ago. The asteroid broke up some time later and this small piece of the asteroid was captured by Earth's gravity and fell to the ground. (Copyright Calvin J. Hamilton)
Iron Meteorite This iron meteorite was found at Victoria Land, Antarctica. This type of meteorite gets its name because it is mostly made of the elements iron and nickel. This sample is probably a small piece from the core of a large asteroid that broke apart. (Copyright Calvin J. Hamilton)
Polished Iron Meteorite This Iron (III E) Meteorite contains a distinctive crystal pattern known as the Widmanstaten structure. It was fashioned over thousands or millions of years in a low gravity environment at an extremely low rate of cooling producing large crystals of nickel-rich and nickel-poor metallic bands. Such a structure is impossible to forge making the identity of this and similar iron meteorites absolute. Laboratories are only able to imitate it on the microscopic scale. This sample has been cut, polished and etched with acid to enhance the view of the Widmanstaten structure. (Copyright Calvin J. Hamilton)
Edmonton - Iron (III CD) Meteorite This meteorite was found in 1942. (Copyright Calvin J. Hamilton)
Martian Meteorite This meteorite fell in 1911 in Alexandria, Egypt. It is believed to have formed on Mars based on its dense pyroxene (greenish-gray) and olivine (brown) crystals which are a signature of martian molten rock. It also contains water-bearing minerals. (Copyright Calvin J. Hamilton)
Martian Meteorite Slice This meteorite fell in 1962 in Katsina Province, Nigeria. It is believed that it is a fragment of a Martian lava flow. It found its way to Earth when a giant impact on Mars catapulted rock fragments into space. A close look at the black glass veins show they are impact melt that contain Martian gases. (Copyright Calvin J. Hamilton)
Peekskill Meteorite This meteorite is famous for the fact that when it fell on October 9, 1992 it destroyed the trunk of a car in Westchester County, New York. (Copyright Calvin J. Hamilton)
Stony-iron Meteorite This stoyn-iron, Pallasite meteorite was found in Atacama, Chile in 1822. (Copyright Calvin J. Hamilton)
Stony-iron Meteorite This Stony-iron , pallasite meteorite was found in 1909 in Chihuahua, Mexico. (Copyright Calvin J. Hamilton)
Vesta Meteorite This meteorite is assumed to be a sample of the crust of the asteroid Vesta, which is only the third solar system object beyond Earth where scientists have a laboratory sample (the other extraterrestrial samples are from Mars and the Moon). The meteorite is unique because it is made almost entirely of the mineral pyroxene, common in lava flows. The meteorite's mineral grain structure also indicates it was once molten, and its oxygen isotopes are unlike oxygen isotopes found for all other rocks of the Earth and Moon. The meteorite's chemical identity points to the asteroid Vesta because it has the same unique spectral signature of the mineral pyroxene.
Most of the identified meteorites from Vesta are in the care of the Western Australian Museum. This 1.4 pound (631 gm) specimen comes from the New England Meteoritical Services. It is a complete specimen measuring 9.6 x 8.1 x 8.7 centimeters (3.7 x 3.1 x 3.4 inches), showing the fusion crust, evidence of the last stage in its journey to Earth. (Photo Credit: R. Kempton, New England Meteoritical Services)
Sun, Planet and Satellite Data
Table of Contents
Historical Data
| Name | # | Orbits | Date | Discoverer |
|---|---|---|---|---|
| Sun | - | - | - | |
| Mercury | I | Sun | - | - |
| Venus | II | Sun | - | - |
| Earth | III | Sun | - | - |
| Moon | I | Earth | - | - |
| Mars | IV | Sun | - | - |
| Phobos | I | Mars | 1877 | Asaph Hall |
| Deimos | II | Mars | 1877 | Asaph Hall |
| Jupiter | V | Sun | - | - |
| Metis | XVI | Jupiter | 1979 | Stephen Synnott |
| Adrastea | XV | Jupiter | 1979 | D. Jewitt & E. Danielson |
| Amalthea | V | Jupiter | 1892 | Edward Emerson Barnard |
| Thebe | XIV | Jupiter | 1979 | Stephen Synnott |
| Io | I | Jupiter | 1610 | Simon Marius & Galileo Galilei |
| Europa | II | Jupiter | 1610 | Simon Marius & Galileo Galilei |
| Ganymede | III | Jupiter | 1610 | Simon Marius & Galileo Galilei |
| Callisto | IV | Jupiter | 1610 | Simon Marius & Galileo Galilei |
| Leda | XIII | Jupiter | 1974 | C. Kowal |
| Himalia | VI | Jupiter | 1904 | C. Perrine |
| Lysithea | X | Jupiter | 1938 | S. Nicholson |
| Elara | VII | Jupiter | 1905 | C. Perrine |
| Ananke | XII | Jupiter | 1951 | S. Nicholson |
| Carme | XI | Jupiter | 1938 | S. Nicholson |
| Pasiphae | VIII | Jupiter | 1908 | P. Melotte |
| Sinope | IX | Jupiter | 1914 | S. Nicholson |
| Saturn | VI | Sun | - | - |
| Pan | XVIII | Saturn | 1990 | Mark R. Showalter |
| Atlas | XV | Saturn | 1980 | R. Terrile |
| Prometheus | XVI | Saturn | 1980 | S. Collins & others |
| Pandora | XVII | Saturn | 1980 | S. Collins & others |
| Epimetheus | XI | Saturn | 1980 | R. Walker |
| Janus | X | Saturn | 1966 | Audouin Dollfus |
| Mimas | I | Saturn | 1789 | William Herschel |
| Enceladus | II | Saturn | 1789 | William Herschel |
| Tethys | III | Saturn | 1684 | Giovanni Domenico Cassini |
| Telesto | XIII | Saturn | 1980 | B. Smith & others |
| Calypso | XIV | Saturn | 1980 | B. Smith & others |
| Dione | IV | Saturn | 1684 | Giovanni Domenico Cassini |
| Helene | XII | Saturn | 1980 | P. Laques & J. Lecacheus |
| Rhea | V | Saturn | 1672 | Giovanni Domenico Cassini |
| Titan | VI | Saturn | 1655 | Christiaan Huygens |
| Hyperion | VII | Saturn | 1848 | William Cranch Bond |
| Iapetus | VIII | Saturn | 1671 | Giovanni Domenico Cassini |
| Phoebe | IX | Saturn | 1898 | William Henry Pickering |
| Uranus | VII | Sun | 1781 | William Herschel |
| Cordelia | VI | Uranus | 1986 | Voyager 2 |
| Ophelia | VII | Uranus | 1986 | Voyager 2 |
| Bianca | VIII | Uranus | 1986 | Voyager 2 |
| Cressida | IX | Uranus | 1986 | Voyager 2 |
| Desdemona | X | Uranus | 1986 | Voyager 2 |
| Juliet | XI | Uranus | 1986 | Voyager 2 |
| Portia | XII | Uranus | 1986 | Voyager 2 |
| Rosalind | XIII | Uranus | 1986 | Voyager 2 |
| Belinda | XIV | Uranus | 1986 | Voyager 2 |
| Puck | XV | Uranus | 1985 | Stephen Synnott |
| Miranda | V | Uranus | 1948 | Gerard Kuiper |
| Ariel | I | Uranus | 1851 | William Lassell |
| Umbriel | II | Uranus | 1851 | William Lassell |
| Titania | III | Uranus | 1787 | William Herschel |
| Oberon | IV | Uranus | 1787 | William Herschel |
| Neptune | VIII | Sun | 1846 | Johann Gotfried Galle |
| Naiad | III | Neptune | 1989 | Voyager 2 |
| Thalassa | IV | Neptune | 1989 | Voyager 2 |
| Despina | V | Neptune | 1989 | Voyager 2 |
| Galatea | VI | Neptune | 1989 | Voyager 2 |
| Larissa | VII | Neptune | 1989 | Stephen Synnott |
| Proteus | VIII | Neptune | 1989 | Stephen Synnott |
| Triton | I | Neptune | 1846 | William Lassell |
| Nereid | II | Neptune | 1949 | Gerard Kuiper |
| Pluto | IX | Sun | 1930 | Clyde W. Tombaugh |
| Charon | I | Pluto | 1978 | J. Christy |
Key:
Name          Name of the planet or satellite.
Orbits        Sun or planet about which it orbits.
Date          Date of discovery.
Discoverer    Discoverer.
No comments:
Post a Comment